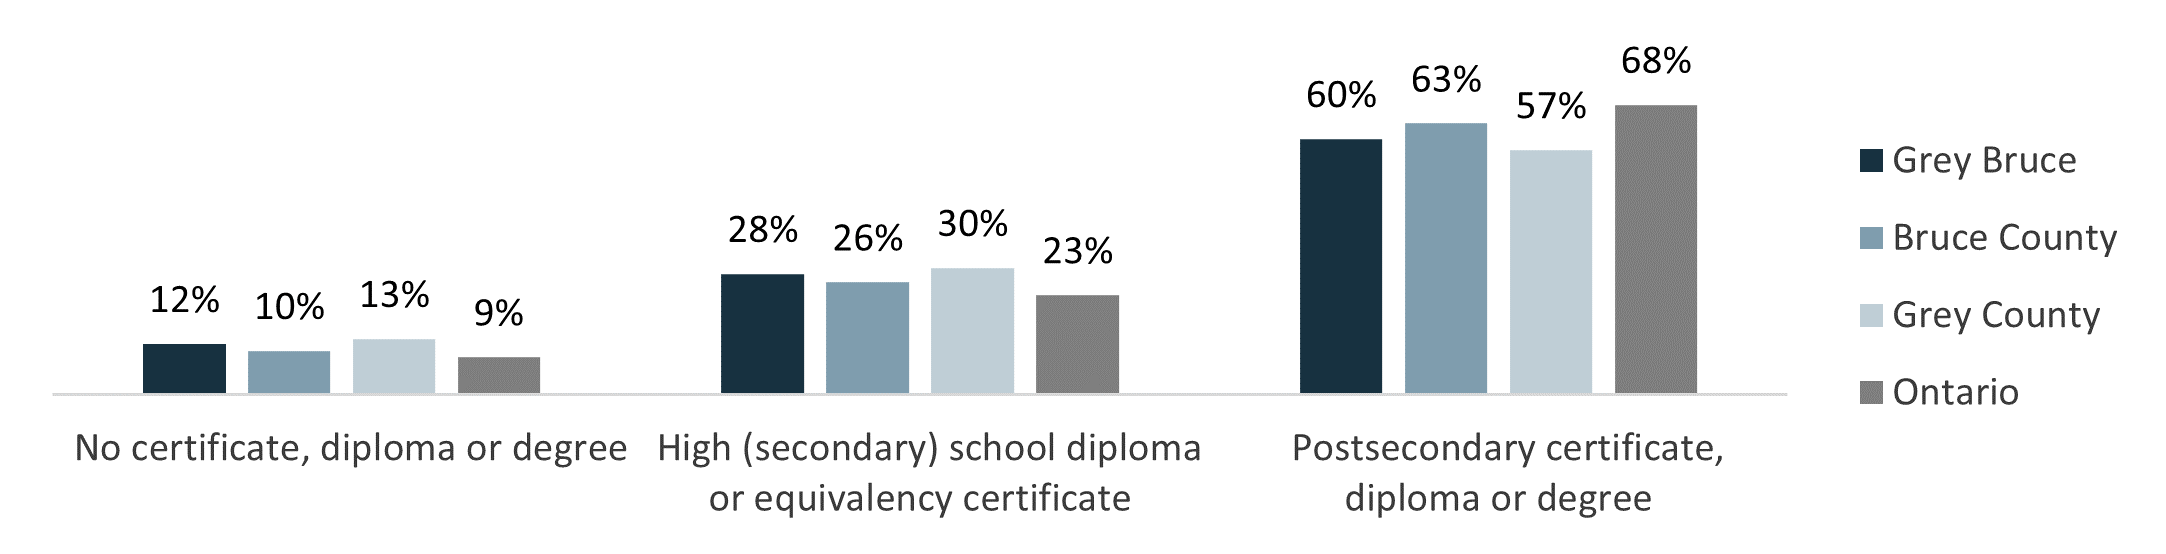
Education
Highest Educational Attainment
Ten-Year Change in Educational Attainment
Educational Attainment by Sex
Educational Attainment by Age
Field of Study
Highest Educational Attainment
This census indicator refers to the highest level of education that a person has successfully completed. Figure 1 presents the population aged 25-64 in Bruce County, Grey County, and Ontario by their highest educational attainment in 2016. Adults who had not successfully completed any educational certificate, diploma, or degree made up 12.3% of the population aged 25-64 in Bruce County, and 15.3% in Grey County; both higher than the Ontario proportion of 11.5%.
A high school diploma or equivalency certificate was the highest educational qualification among 26.4% of adults aged 25-64 years in Bruce County, and 28.8% in Grey County- higher than the provincial proportion of 23.7%. About 61% of adults in Bruce County and 56% in Grey County had completed a postsecondary certificate, diploma, or degree in 2016. Fewer adults in both counties had postsecondary qualifications relative to Ontario (64.8%).
Figure 1. Highest Educational Attainment among Population Aged 25-64, Bruce County, Grey County and Ontario, 2016

Figure 2 presents the highest educational attainment among the population aged 25-64 in Grey Bruce municipalities in 2016. Most Grey Bruce municipalities had more adults with no educational qualifications relative to Ontario. Southgate had the highest percentage of adults with no educational qualifications by a wide margin, at 28.1%. The percentage of adults whose highest level of education was a high school diploma was higher than Ontario in every Grey Bruce municipality except Saugeen Shores. Most Grey Bruce municipalities had fewer adults with postsecondary qualifications than Ontario, except Saugeen Shores, The Blue Mountains, and Kincardine.
Figure 2. Highest Educational Attainment among Population Aged 25-64, Grey Bruce Municipalities, 2016

Figure 3 presents the percentages of adults aged 25-64 who had completed various postsecondary qualifications in 2016 in Bruce County, Grey County, and Ontario. Compared to adults in Ontario, adults in Bruce and Grey counties were more likely to have completed an apprenticeship or trades certificate, or college diploma, and less likely to have completed a university degree at the bachelor level or above. A small percentage of adults had completed a university certificate or diploma below the bachelor level (not included in the figure).
Figure 3. Postsecondary Educational Attainment among Population Aged 25-64, Bruce County, Grey County and Ontario 2016

Ten-Year Change in Educational Attainment
Figure 4 presents the ten-year change in the percentages of adults who had no educational qualifications, and whose highest educational qualification was a high school diploma in Grey Bruce and Ontario between 2006 and 2016. In Grey Bruce and Ontario, the percentage of adults aged 25-64 who had not completed any educational qualifications decreased between 2006 and 2016, while the percentage of adults whose highest educational qualification was a high school diploma remained relatively stable.
Figure 4. Ten-year Change in Educational Attainment among Population Aged 25-64, No Certificate and High School Diploma, Grey Bruce and Ontario, 2006 & 2016

Figure 5 presents the ten-year change in the percentages of adults who had various postsecondary qualifications in Grey Bruce and Ontario between 2006 and 2016. In Grey Bruce and Ontario, the percentage of adults aged 25-64 whose highest educational qualification was an apprenticeship or trades certificate decreased between 2006 and 2016. A growing percentage of adults in Grey Bruce and Ontario earned college and university qualifications over this time period.
Figure 5. Ten-year Change in Educational Attainment among Population Aged 25-64, Postsecondary Qualifications, Grey Bruce and Ontario, 2006 & 2016

Educational Attainment by Sex
Figure 6 presents educational attainment among men and women aged 25-64 in Bruce County, Grey County, and Ontario in 2016. Both men and women in Grey County tended to have less education than their counterparts in Ontario. This was also true in Bruce County, but to a lesser extent.
Women were more likely to have postsecondary qualifications than men, equally as likely to hold a high school diploma as their highest educational qualification, and less likely not to have completed any educational qualifications, both locally and provincially. The difference between the percentages of men and women with no educational qualifications was more pronounced in Grey and Bruce counties than in Ontario. The gender disparity among men and women with postsecondary qualifications was less pronounced in Bruce County than in Grey County and Ontario.
Figure 6. Educational Attainment among Men and Women Aged 25-64, Bruce County, Grey County and Ontario, 2016

Educational Attainment by Age
Figures 7 and 8 compare educational attainment across age groups in Grey Bruce and Ontario. Grey Bruce residents tended to have fewer educational qualifications than Ontarians overall, but in the oldest age groups, educational qualifications were similar between Grey Bruce and Ontario, and in the youngest age group, Grey Bruce residents were less likely than Ontario residents to have no educational qualifications
Figure 7. Educational Attainment by Age Group, Ages 15 through 44, Grey Bruce and Ontario, 2016

Figure 8. Educational Attainment by Age Group, Aged 45 and Older, Grey Bruce and Ontario, 2016

Field of Study
Field of study refers to the discipline or area of learning or training associated with a particular course or program of study. This indicator refers to the predominant discipline or area of learning or training of a person's highest completed postsecondary certificate, diploma or degree.
Figures 9 and 10 display the major categories of field of study among 25-64 year olds with postsecondary qualifications. In 2016, one quarter of postsecondary graduates aged 25-64 in Grey Bruce earned their qualifications in architecture, engineering, and related services, compared to 18.7% in Ontario. Of these, most had studied mechanic and repair technologies, construction trades, and engineering technologies/related fields (see full report for details). The next most common area of study among Grey Bruce postsecondary graduates was health and health-related fields at 18.4%; higher than the Ontario percentage of 14.1. Other areas of study that were more popular among graduates in Grey Bruce than Ontario were personal, protective, and transportation services, and agriculture, natural resources, and conservation.
Figure 9. Most Common Fields of Study among 25-64 Year Olds with Postsecondary Qualifications, Grey Bruce and Ontario, 2016

Figure 10. Least Common Fields of Study among 25-64 Year Olds with Postsecondary Qualifications, Grey Bruce and Ontario 2016

Read the full report here: Census Release VI Education
Terms
Highest certificate, diploma or degree
This variable refers to the highest level of education that a person has successfully completed and is derived from the educational qualifications questions, which asked for all certificates, diplomas and degrees to be reported.
The general hierarchy used in deriving this variable (high school, trades, college, university) is loosely tied to the 'in-class' duration of the various types of education. At the detailed level, someone who has completed one type of certificate, diploma or degree will not necessarily have completed the credentials listed below it in the hierarchy. For example, a person with an apprenticeship or trades certificate or diploma may not have completed a high school certificate or diploma, nor does an individual with a 'master's degree' necessarily have a 'certificate or diploma above bachelor level.' Although the hierarchy may not fit all programs perfectly, it gives a general measure of educational attainment.
Data specific to Neyaashiinigmiing and Saugeen First Nations are not presented due to high non-response rates
Data in this release are based on the short-form census which samples 25% of the population. Statistics Canada calculates estimates for the entire population based on this sample.
To ensure confidentiality, the values, including totals, are randomly rounded either up or down to a multiple of '5' or '10.' To understand these data, you must be aware that each individual value is rounded. A value of zero (-) does not necessarily mean that there are no people in that particular category.
Sources:
Statistics Canada. 2017. Various Geographies. Census Profile - Age, Sex, Type of Dwelling, Families, Households, Marital Status, Language, Income, Immigration and Ethnocultural Diversity, Housing, Aboriginal Peoples, Education, Labour, Journey to Work, Mobility and Migration, and Language of Work for Canada, Provinces and Territories, Census Divisions and Census Subdivisions. 2016 Census. Statistics Canada Catalogue no. 98-401-X2016054. Ottawa. Released November 29, 2017 http://www5.statcan.gc.ca/olc-cel/olc?ObjId=98-401-X&ObjType=2&lang=en&Limit=0 (accessed November 29, 2017).
Definitions: Statistics Canada, 2016. Dictionary, Census of Population 2016. http://www12.statcan.gc.ca/census-recensement/2016/ref/dict/index-eng.cfm