Income
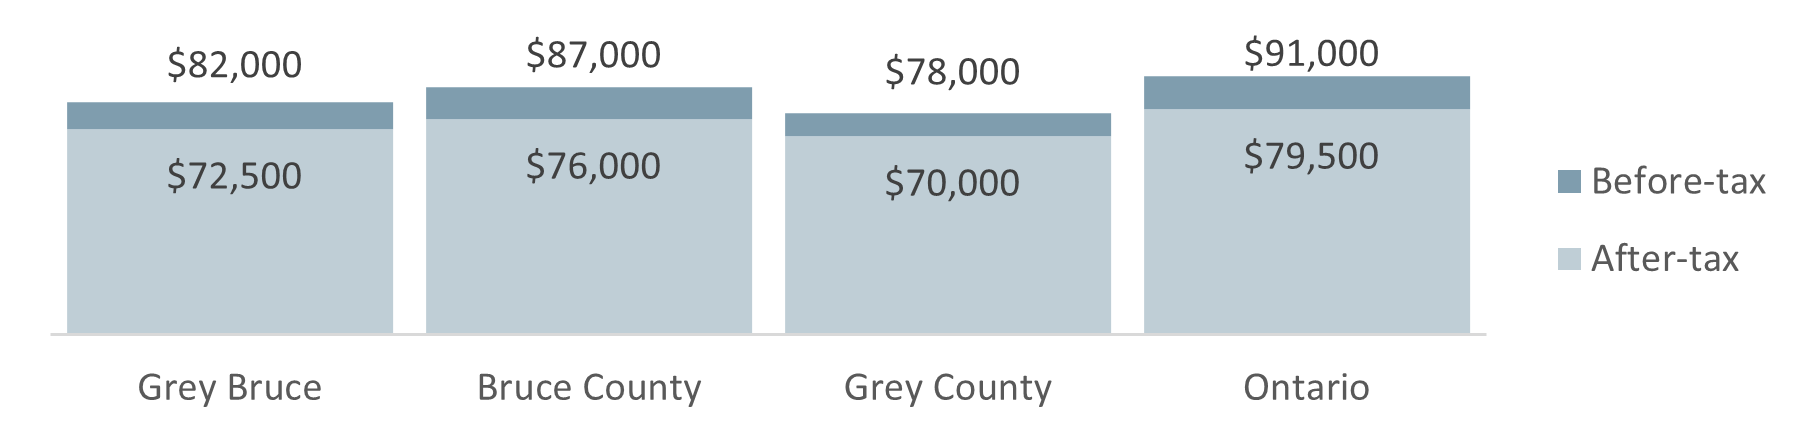
The median household income for Grey Bruce households in 2020 was $82,000 before taxes and $72,500 after taxes. Median household income after taxes in Grey Bruce was lower than in Ontario.
Figure 1. Median Household Income Before and After Taxes, 2020
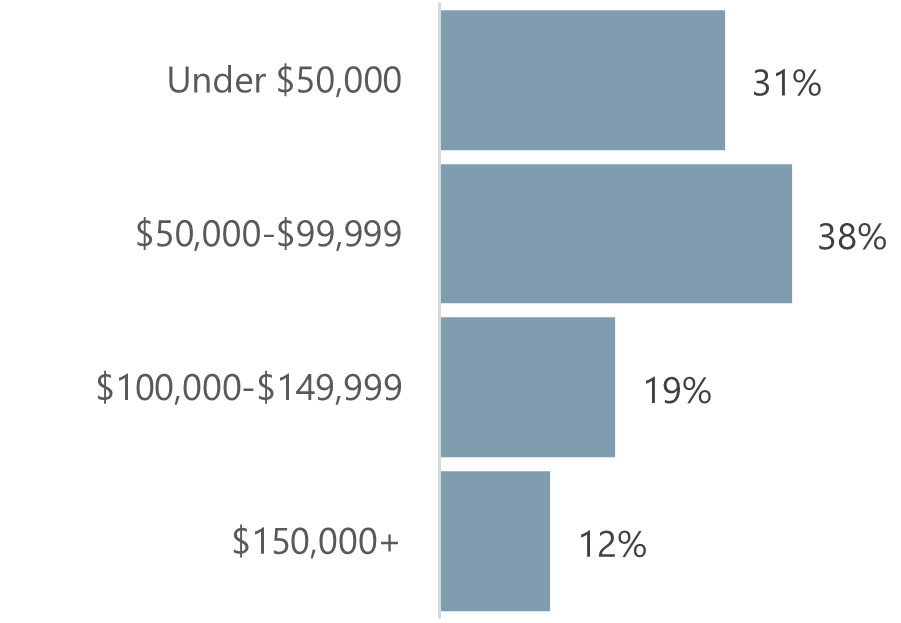
Nearly a third (31%) of Grey Bruce households had an after-tax income of less than $50,000 in 2020. Thirty-eight percent of households took home between $50,000 and $99,999, 19% took home between $100,000 and $149,999, and 12% took home $150,000 or more.
Figure 2. Distribution of Households by Median After-tax Income, Grey Bruce 2020
Low Income
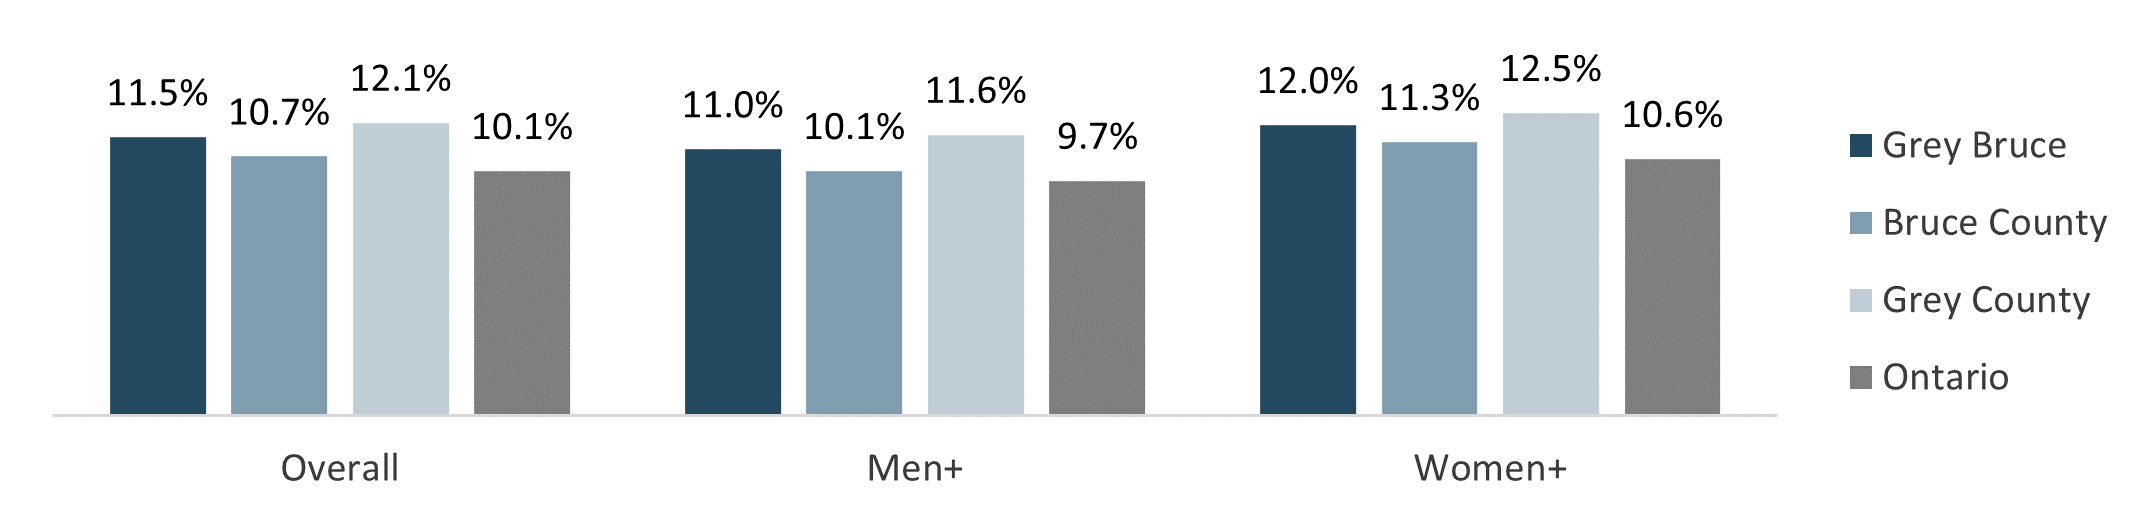
Eleven point five percent of Grey Bruce residents were living in low income1 in 2020, down from 14.6% in 2015. A higher proportion of men+ and women+ in both Grey and Bruce counties were in low income than in Ontario.
Figure 1. Proportion of Population in Low-income According to LIM-AT, by Gender, 2020
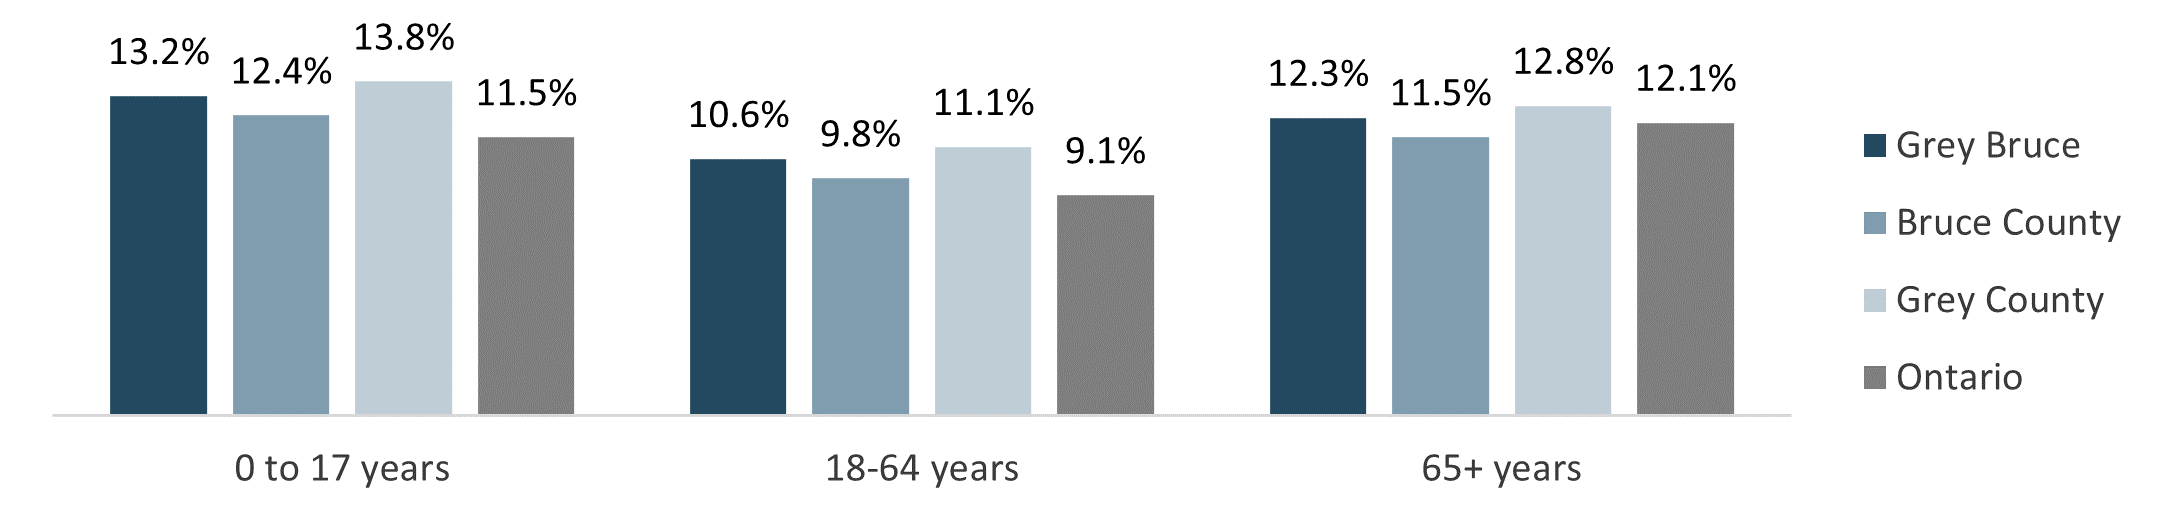
Children, youths, and older adults are more likely to live in low income than working-aged adults in each of the geographies profiled below. Thirteen percent of children and youth under the age of 18 in Grey Bruce live in low income, as do 10.6% of working-aged adults, and 12.3% of older adults aged 65 and older.
Figure 2. Proportion of Population in Low-income According to LIM-AT, by Age Group, 2020
Additional Context
Income-related information in the census is based on the year prior to the census- in this case the year 2020. The COVID-19 pandemic resulted in losses in employment income, which were then accompanied by COVID-19 emergency and recovery benefits. These COVID-19-related benefits were temporary and as a result, some income trends presented here may not accurately reflect long-term trends.
Data Notes and Sources
Read the full report here
Data Source: Statistics Canada. 2023. Census Profile. 2021 Census of Population. Statistics Canada Catalogue number 98-316-X2021001. Ottawa. Released March 29, 2023. https://www12.statcan.gc.ca/census-recensement/2021/dp-pd/prof/index.cfm?Lang=E (accessed June 5, 2023).
Rounding: All counts in census tabulations undergo random rounding, a process that transforms all raw counts into randomly rounded counts. This reduces the possibility of identifying individuals in the tabulations. To understand these data, you must be aware that each individual value is rounded. As a result, when these data are summed or grouped, the total value may not match the individual values since totals and sub-totals are independently rounded. Similarly, percentages, which are calculated on rounded data, may not necessarily add up to 100%.
Gender: Gender refers to an individual's personal and social identity as a man, woman or non-binary person (a person who is not exclusively a man or a woman).2 Beginning in 2022, Statistics Canada will disseminate census information on gender based on the addition of a new gender question, along with the clarification of ‘at birth’ for the question pertaining to a person’s sex. Given that the non-binary population is small, data aggregation to a two-category gender variable is sometimes necessary to protect the confidentiality of responses provided. In these cases, individuals in the category "non-binary persons" are distributed into the other two gender categories and are denoted by the "+" symbol. "Men+" includes men (and/or boys), as well as some non-binary persons. "Women+" includes women (and/or girls), as well as some non-binary persons.3
1. In this report, low income is based on low-income measures, after tax (LIM-AT). Based on the LIM-AT, a household has low income if its after-tax income is less than half of the median after-tax income of all households in Canada. The LIM is adjusted for household size because a household's needs increase as the number of members increases.
2. Statistics Canada. 2023. (table). Census Profile. 2021 Census of Population. Statistics Canada Catalogue no. 98-316-X2021001. Ottawa. Released March 29, 2023. https://www12.statcan.gc.ca/census-recensement/2021/dp-pd/prof/index.cfm?Lang=E (accessed June 12, 2023).
3. Statistics Canada. 2023. (table). Census Profile. 2021 Census of Population. Statistics Canada Catalogue no. 98-316-X2021001. Ottawa. Released March 29, 2023. https://www12.statcan.gc.ca/census-recensement/2021/dp-pd/prof/index.cfm?Lang=E (accessed June 12, 2023).