Labour
Data from the 2021 Census reflect labour market conditions as of May 2021. According to Statistics Canada, “[B]y May 2021, the labour market had rebounded significantly since the first months of the pandemic beginning in March 2020. However, in May 2021, employment remained below its pre-pandemic level [and] the unemployment rate stood at 8.0%, compared with its peak of 13.4% reached in May 2020.1
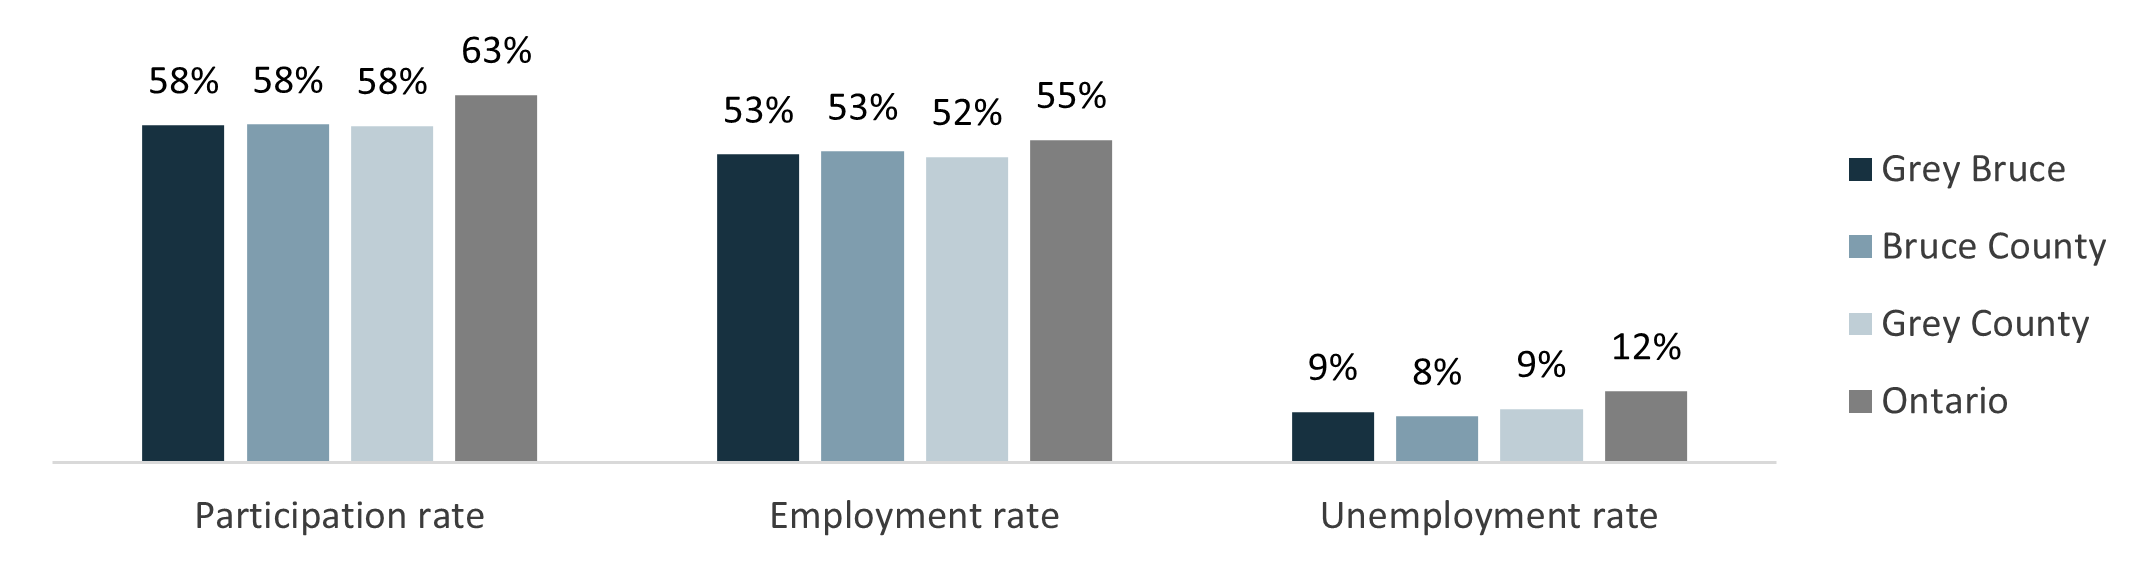
In 2021 there were 82,790 people in the Grey Bruce labour force, representing 58% of the population. Local participation in the labour force was lower than in Ontario at 63%. This is due in part to the Grey Bruce population being older relative to Ontario, though workforces across the province are aging. Similarly, the employment rate in Grey Bruce and its respective counties is lower than in Ontario. The unemployment for Grey Bruce and both counties is also lower than in Ontario.
Figure 1. Employment and Unemployment Rates, 2021
Places of Work & Commuting
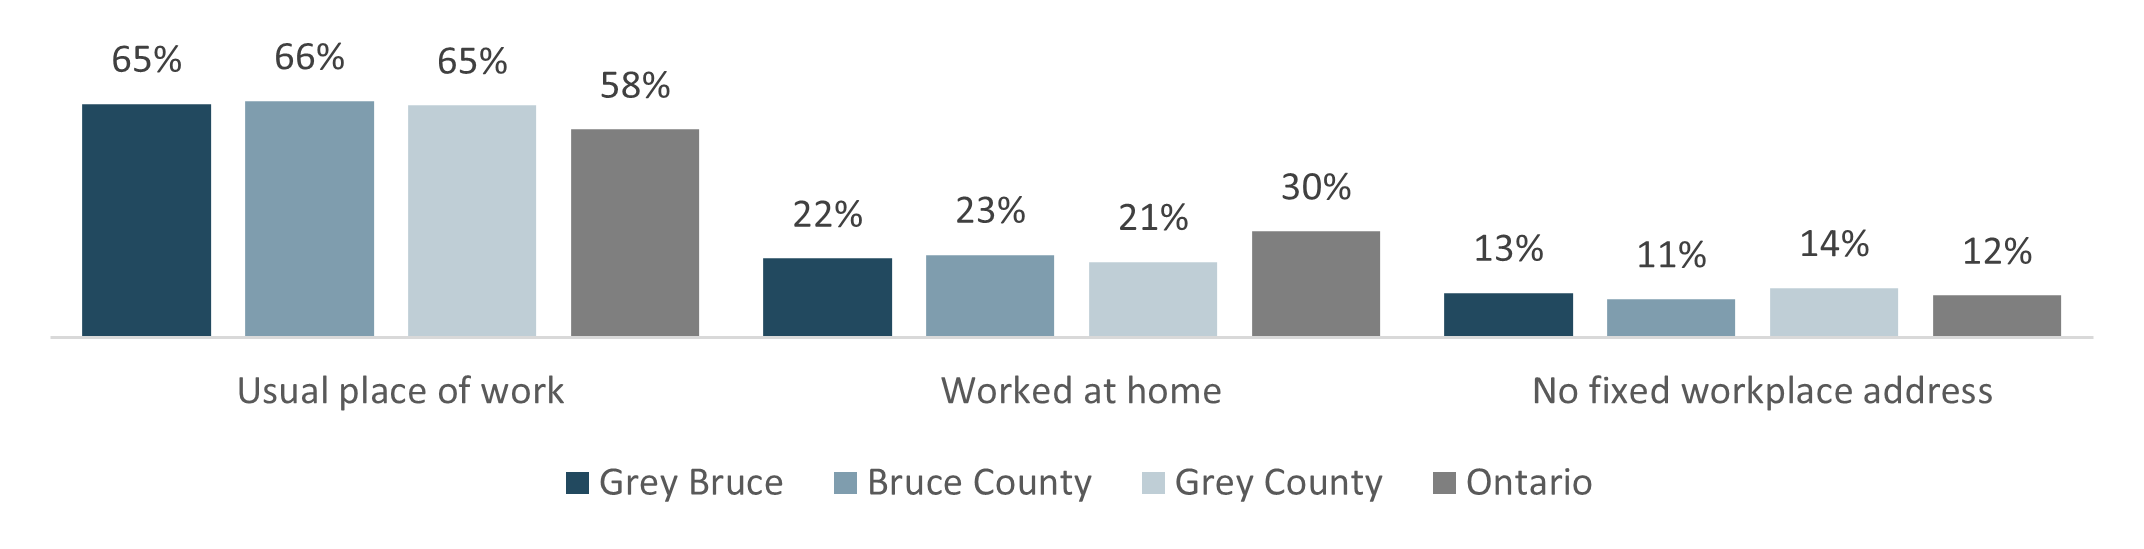
The COVID-19 pandemic led to a shift toward working at home in occupations where this is possible. Sixty-five percent of the employed labour force in Grey Bruce worked at a fixed workplace address in 2021, a 14% decrease from 2016. The proportion of the Grey Bruce labour force who worked primarily from home increased by 72% between 2016 and 2021, to 22%. The proportion with no fixed workplace address (such as building and landscape contractors, and independent truck drivers) increased by 10% to 13%. The proportion working outside Canada remained small, at less than 1%.
Figure 2. Employed Labour Force by Place of Work, 2021
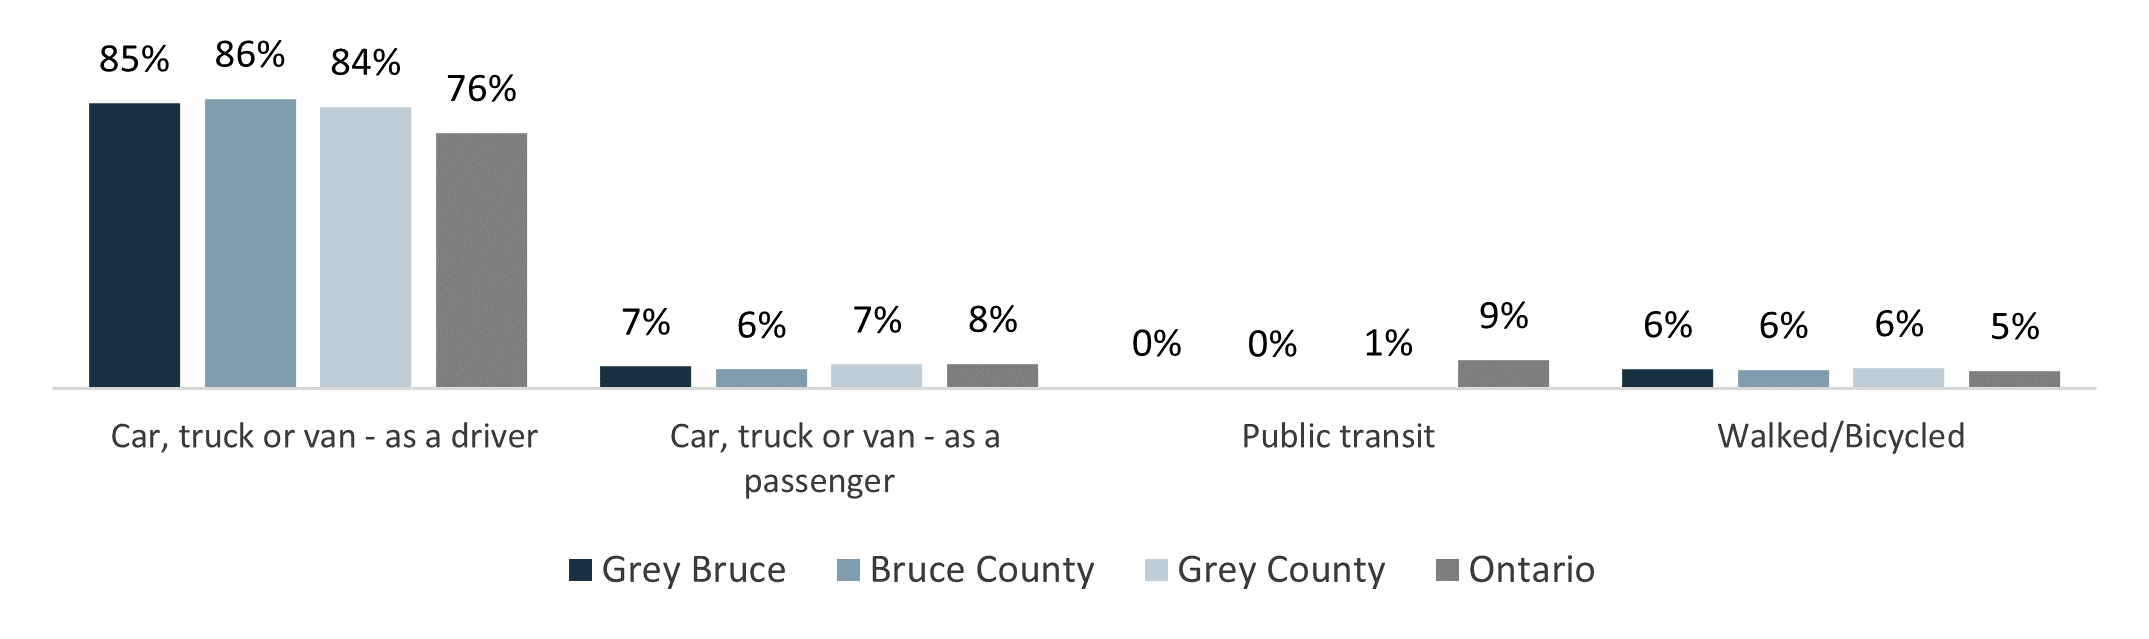
Commuting durations in Grey Bruce tend to be shorter compared to Ontario- 39% of Grey Bruce commuters spend less than 15 minutes getting to work. Among the employed members of the Grey Bruce labour force who commuted to either a fixed workplace address or to one or more unfixed workplace addresses, driving a car, truck or van remained the dominant mode of commuting in 2021, at 85%. Walking or cycling is the main mode of commuting for 6% of Grey Bruce commuters.
Figure 3. Employed Labour Force by Main Mode of Commuting, 2021
Data Notes and Sources
Read the full report here
Data Source: Statistics Canada. 2023. Census Profile. 2021 Census of Population. Statistics Canada Catalogue number 98-316-X2021001. Ottawa. Released March 29, 2023. https://www12.statcan.gc.ca/census-recensement/2021/dp-pd/prof/index.cfm?Lang=E (accessed June 5, 2023).
Rounding: All counts in census tabulations undergo random rounding, a process that transforms all raw counts into randomly rounded counts. This reduces the possibility of identifying individuals in the tabulations. To understand these data, you must be aware that each individual value is rounded. As a result, when these data are summed or grouped, the total value may not match the individual values since totals and sub-totals are independently rounded. Similarly, percentages, which are calculated on rounded data, may not necessarily add up to 100%.
1.Statistics Canada. 2023. “Jobs in Canada: Navigating changing local labour markets.” The Daily. Nov 30. Statistics Canada catalogue no. 11-001-X. https://www150.statcan.gc.ca/n1/daily-quotidien/221130/dq221130b-eng.htm (accessed Aug 8, 2023).