Housing
Usual Residents
Homeownership
Affordability
Affordability: Owner vs Renter Households
Affordability: Household Type
Subsidized Housing
Monthly Shelter Costs
Adequacy (Dwelling Condition)
Suitability (Crowding)
Core Housing Need
Dwelling Value
Dwelling Type
Dwellings Occupied by Usual Residents
All of the housing information presented on this page is based on private dwellings occupied by usual residents, rather than for unoccupied dwellings or dwellings occupied solely by temporary or seasonal residents. The percentage of dwellings occupied by usual residents is a measure of the regular, non-seasonal or non-vacation housing use in a community. Communities with a higher percentage of dwellings occupied by their usual residents have a lower proportion of ‘vacation homes.’
Figure 1 displays the percentages of private dwellings in Grey and Bruce counties and Ontario that were occupied by usual residents in 2016. Grey County, and particularly Bruce County had relatively fewer dwellings occupied by usual residents than Ontario, indicating a higher proportion of vacation homes.
Figure 1. Percentage of Private Dwellings Occupied by Usual Residents, Bruce County, Grey County and Ontario, 2016
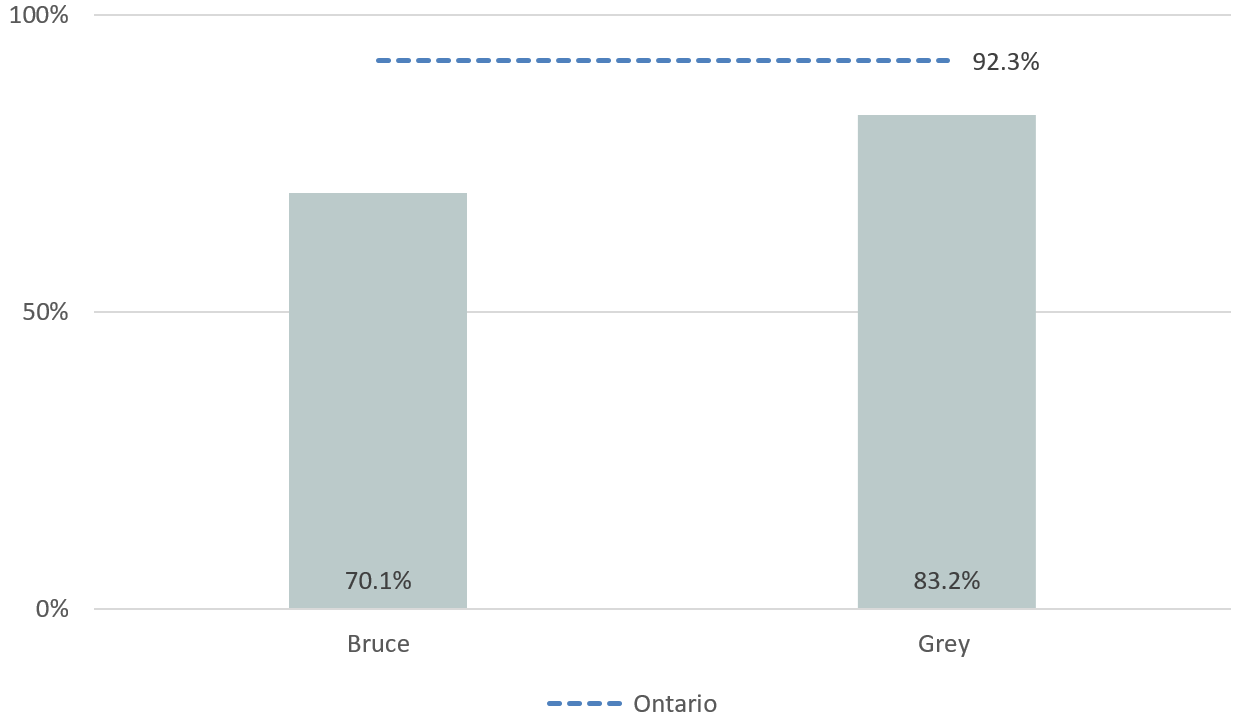
Figure 2 displays the percentages of private dwellings occupied by usual residents in each Grey Bruce municipality in 2016. Many Grey Bruce municipalities have very low proportions of usual residents, and high proportions of seasonal and vacation housing.
Figure 2. Percentage of Private Dwellings Occupied by Usual Residents, Grey Bruce Municipalities, 2016
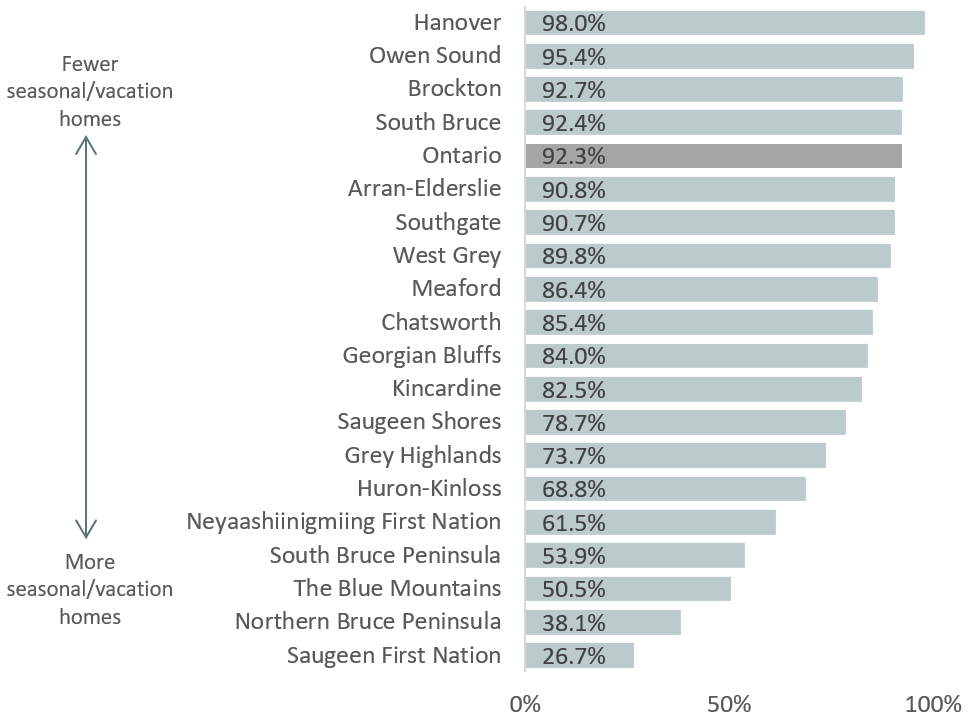
While data specific to Neyaashiinigmiing and Saugeen First Nations are not included elsewhere due to high non-response rates, first nation reserve counts are included in this figure because counts of dwellings and type of dwelling are collected by trained enumerators
Homeownership
Figure 3 displays the percentages of private dwellings that were owned and rented in Bruce and Grey counties, and Ontario in 2016. A small fraction (0.2%) of private dwellings in Bruce County were made up of band housing, which refers to shelter occupancy on first nations reserves or settlements (not pictured). Bruce County had a high rate of homeownership, at 81.5%, compared to Grey County, at 76.7%, and Ontario, at 69.7%. Rented dwellings made up 23.3% of private dwellings in Grey County and 18.3% in Bruce County- both lower than Ontario. Homeownership rates have fallen slightly in both counties since 2006, from 82.7% in Bruce County, and 78.4% in Grey County.
Figure 3. Percentage of Private Dwellings that are Owned and Rented, Bruce County, Grey County, and Ontario, 2016
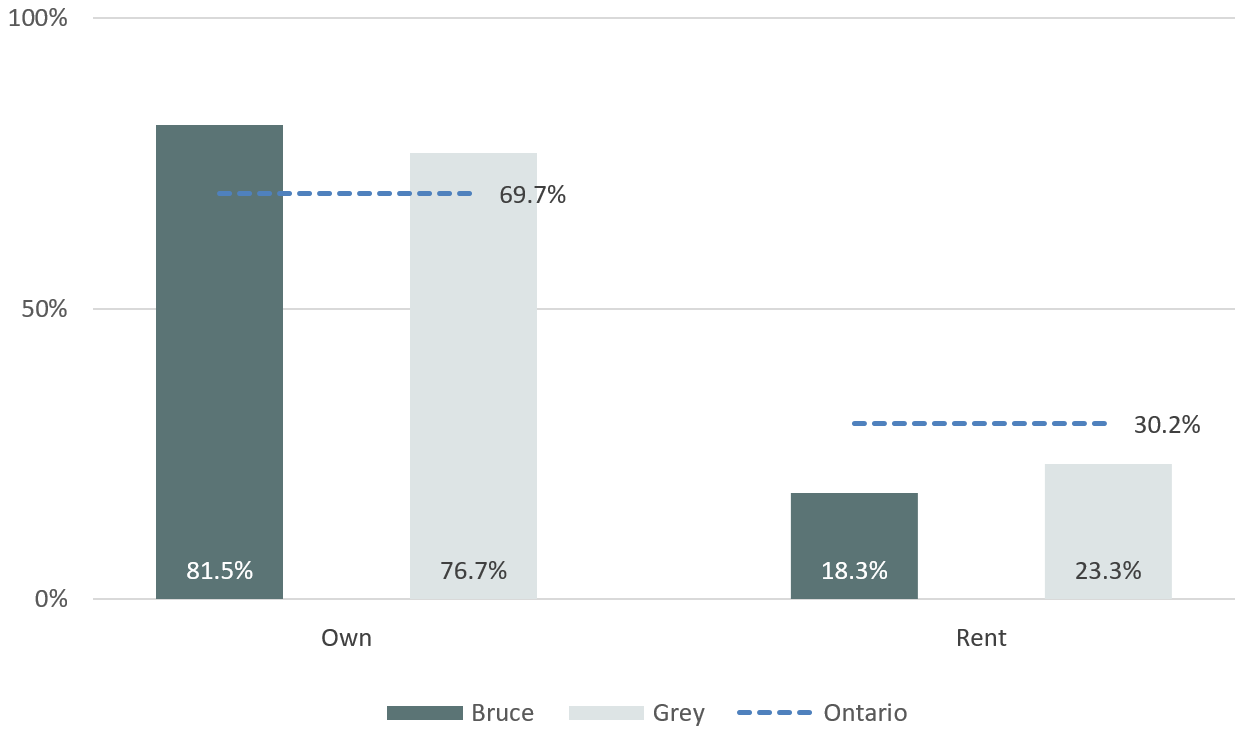
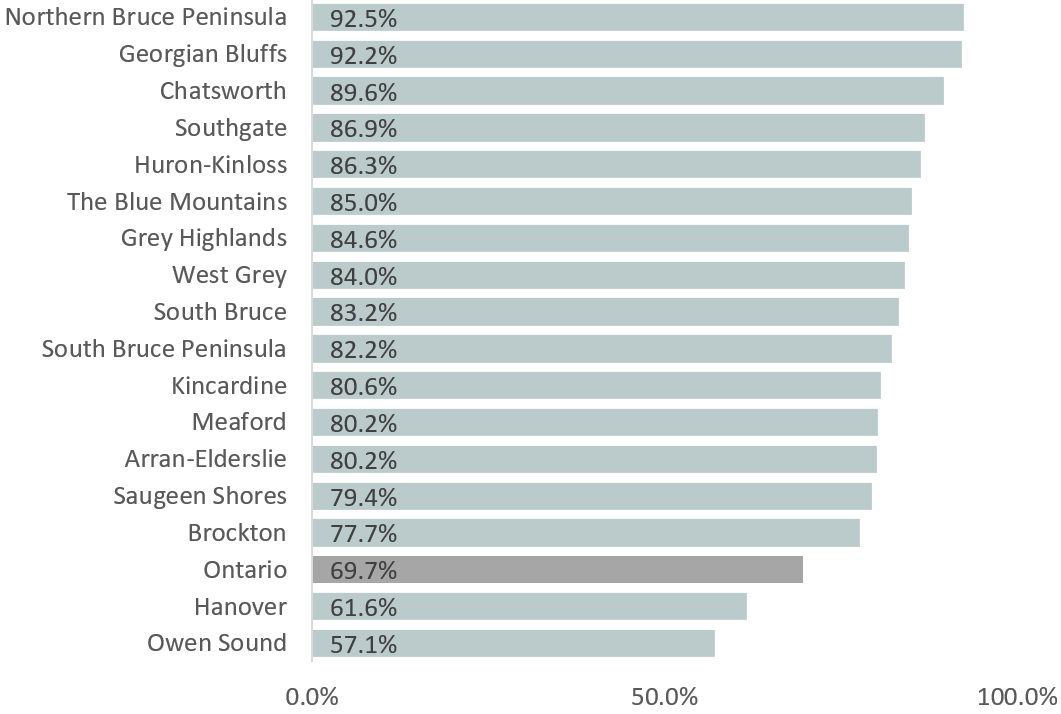
Figure 4 displays the percentages of private dwellings that were owned in Grey Bruce municipalities in 2016. Every Grey Bruce municipality had a higher rate of homeownership than Ontario, except Meaford and Northern Bruce Peninsula.
Figure 4. Percentage of Private Dwellings that are Owned, Grey Bruce Municipalities, 2016
Housing Affordability
The percentage of a household’s total (before-tax) income that is spent on shelter costs can be used to measure housing affordability. A household is considered to have unaffordable shelter costs if 30% or more of the household’s total income is spent on shelter costs (mortgage payments, rent payments, utilities, taxes etc.).
Table 1 displays the rates of unaffordable housing in Grey Bruce municipalities in 2006 and 2016, and the direction of change in the rate over that time period. Note that this only includes private dwellings that are not part of a farm, and are not located on a first nations reserve. The rate of unaffordable housing increased slightly in Bruce County from 19.0% to 20.6%, and remained relatively unchanged in Grey County from 24.3% to 24.5%. South Bruce Peninsula, Chatsworth, and Kincardine saw the largest increases in the rate of unaffordable housing.
Table 1. Unaffordable Housing Rate, Grey Bruce Municipalities, 2006 & 2016
| |
Increase/ decrease
|
2006 (%)
|
2016 (%)
|
|
Ontario
|
|
26.9
|
27.7
|
|
Grey Bruce
|
n/a
|
*
|
22.9
|
|
Bruce
|
|
19.0
|
20.6
|
|
Arran-Elderslie
|
|
25.7
|
25.9
|
|
Brockton
|
|
20.6
|
20.1
|
|
Huron-Kinloss
|
|
20.3
|
20.8
|
|
Kincardine
|
|
15.9
|
19.0
|
|
N. Bruce Peninsula
|
n/a
|
*
|
21.4
|
|
Saugeen Shores
|
|
16.5
|
18.1
|
|
South Bruce
|
|
18.8
|
17.2
|
|
S. Bruce Peninsula
|
|
19.6
|
25.2
|
|
Grey
|
|
24.3
|
24.5
|
|
Blue Mountains
|
|
23.8
|
23.0
|
|
Chatsworth
|
|
21.3
|
26.3
|
|
Georgian Bluffs
|
|
17.6
|
14.5
|
|
Grey Highlands
|
|
25.7
|
24.9
|
|
Hanover
|
|
25.2
|
27.1
|
|
Meaford
|
|
23.9
|
21.6
|
|
Owen Sound
|
|
28.9
|
30.2
|
|
Southgate
|
|
23.4
|
25.6
|
|
West Grey
|
|
21.2
|
21.7
|
* Data not applicable or not available for this time period
Housing Affordability: Owner vs. Renter Households
Housing affordability problems affect renters more than owners. [1] In terms of housing affordability, homeowners in Grey County, and particularly Bruce County, fare better than homeowners in Ontario, but renters in Grey Bruce do not fare better than renters in Ontario.
Figure 5 displays the rates of unaffordable housing among owner and renter households for Bruce County, Grey County, and Ontario in 2016. Note that this only includes private dwellings that are not part of a farm, and are not located on a first nations reserve. The unaffordable housing rate among renters was over twice as high as the rate among owners in Bruce and Grey counties and provincially.
Figure 5. Unaffordable Housing Rate among Owner and Renter Households, Bruce County, Grey County, and Ontario, 2016
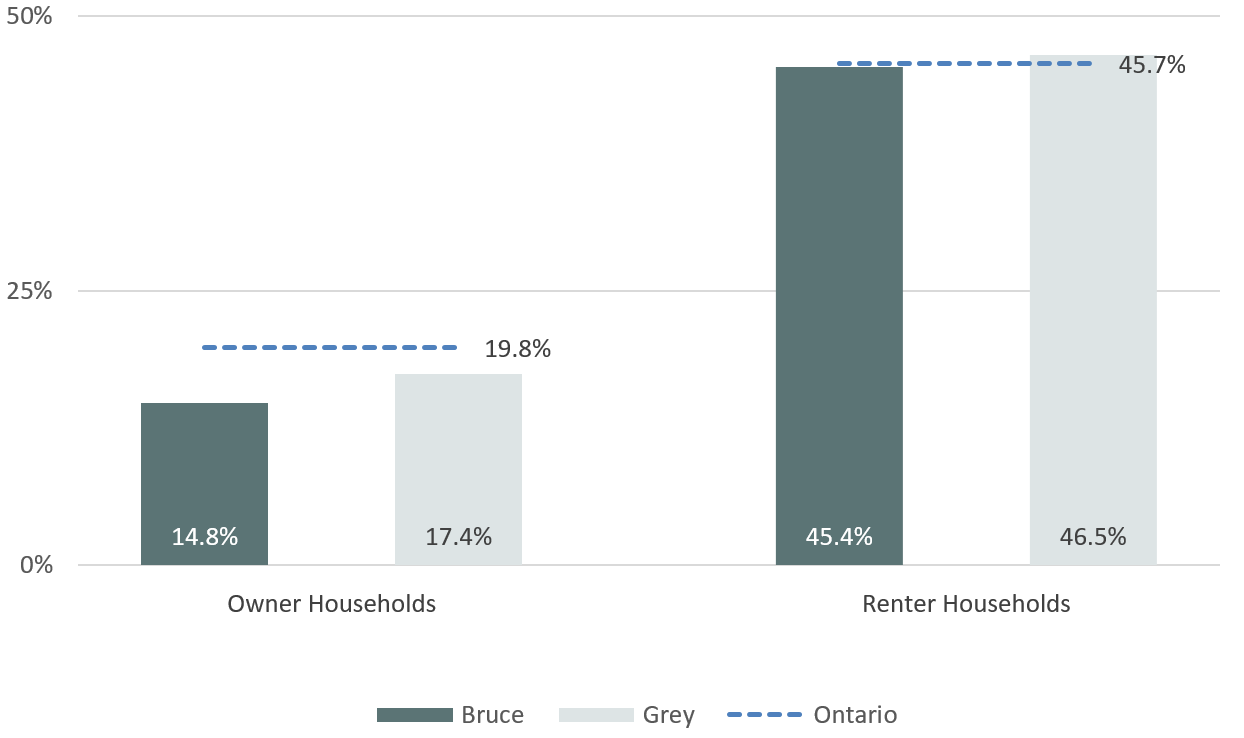
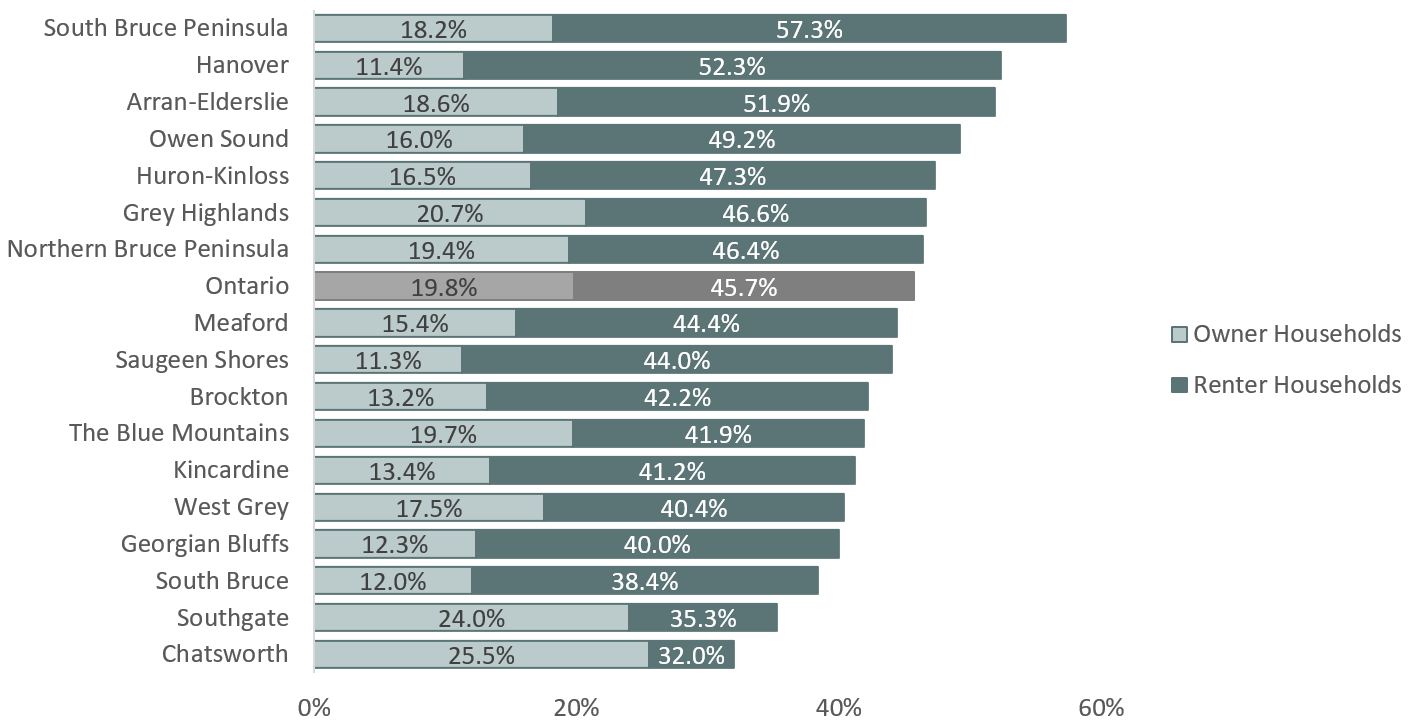
Figure 6 displays the rates of unaffordable housing among owner and renter households for Grey Bruce municipalities in 2016. Note that this only includes private dwellings that are not part of a farm, and are not located on a first nations reserve. The rate of unaffordable housing among renter households was between two to four times higher than among owner households in most municipalities, except in Chatsworth and Southgate. This disparity between renters and owners was highest in Hanover.
Figure 6. Unaffordable Housing Rate among Owner and Renter Households, Grey Bruce Municipalities, 2016
Affordability by Household Type
Census family households can be one-family households (couple families with or without children, and lone-parent households), or multiple-family households (two or more families, or one family living with additional relatives or non-relatives). Non-census families include individuals who live alone, individuals who live with relatives, and individuals who live with non-relatives.
Figure 7 presents rates of unaffordable housing among census-family and non-census-family households for Grey Bruce municipalities in 2016. Note that this only includes private dwellings that are not part of a farm, and are not located on a first nations reserve. Rates of unaffordable housing among people not living in families are over twice as high as the rates among people living in families, both locally and provincially.
Figure 7. Unaffordable Housing Rate among Census-family and Non-census-family Households, Bruce County, Grey County, and Ontario, 2016
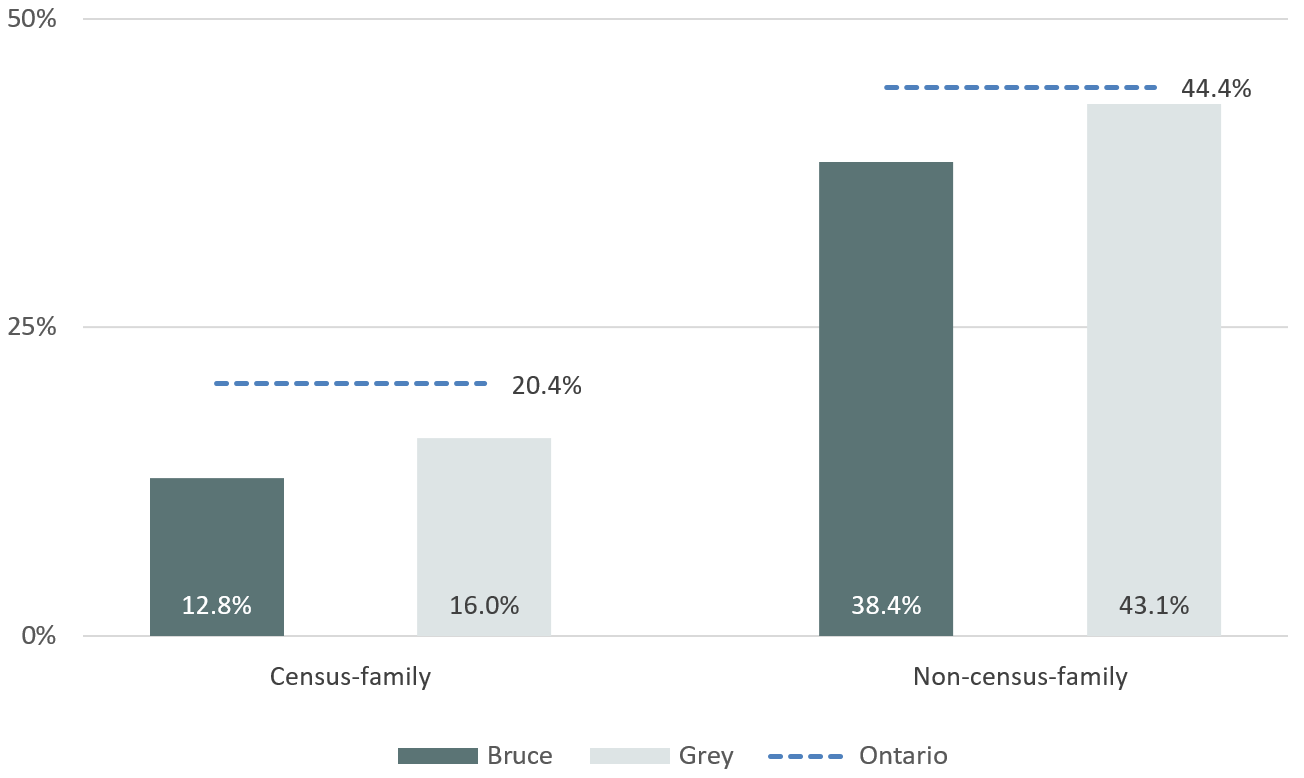
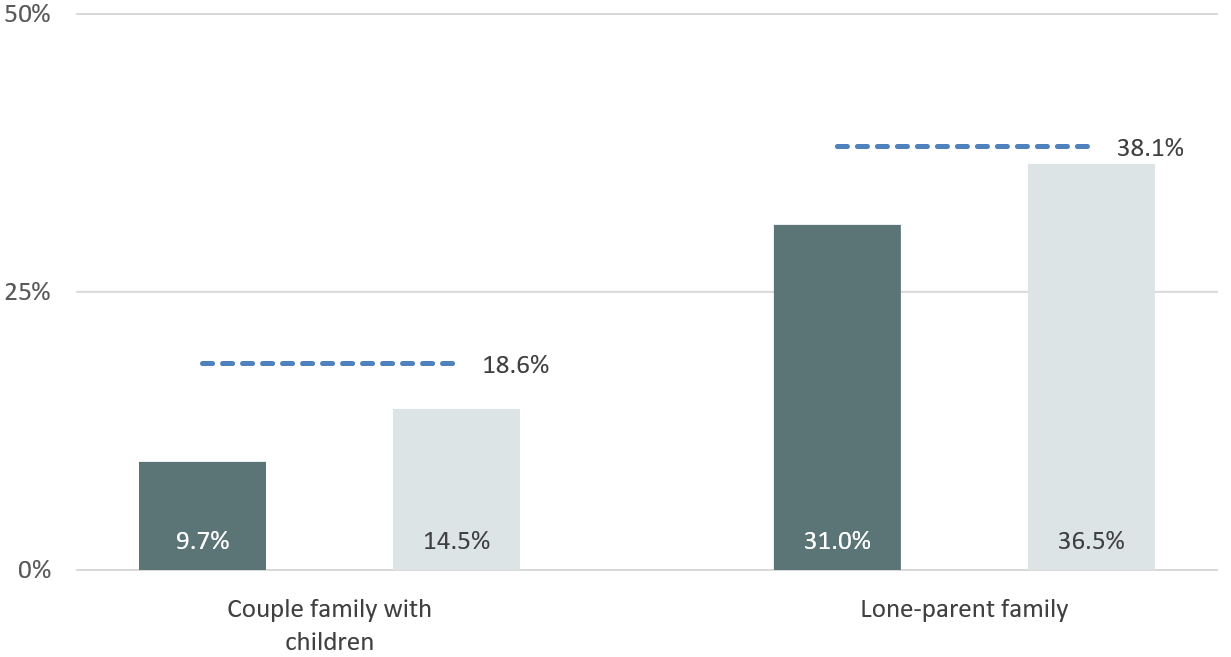
Figure 8 presents unaffordable housing rates among census-family households made up of one-couple-families with children, or lone-parent families. Note that this only includes private dwellings that are not part of a farm, and are not located on a first nations reserve. Of all census family types, lone-parent families are most likely to have unaffordable shelter costs, both locally and provincially. Unaffordable housing rates for lone-parent families are over twice as high as rates for couple families with children in Bruce and Grey counties and Ontario.
Figure 8. Unaffordable Housing Rate among Couple Families with Children and Lone-parent Families, Bruce County, Grey County, and Ontario, 2016
Subsidized Housing
'Subsidized housing' refers to whether a renter household lives in a dwelling that is subsidized. Subsidized housing includes rent geared to income, social housing, public housing, government-assisted housing, non-profit housing, rent supplements and housing allowances. Note that this only includes private dwellings that are not located on a first nations reserve.
In 2016, 16.3% of renter households in Bruce County lived in subsidized housing, as did 17.9% in Grey County, and 15.0% in Ontario. At the municipal level, subsidized housing was most prevalent among renters in Owen Sound, where 23.7% of renters lived in subsidized housing, Meaford, where 23.3% did, and Kincardine, at 22.3%.
Subsidized housing does not necessarily mean affordable housing. While renters in subsidized housing have lower average housing costs than other renters, they also have lower household incomes and expenses (they spend mainly on necessities). [1] In Bruce County, 46% of renters in subsidized housing still spent 30% or more of their total income on shelter costs, as did 40% in Grey County.
Monthly Shelter Costs
Median monthly shelter cost refers to the median monthly total of all shelter expenses paid by households that own or rent their (non-farm, non-reserve) dwelling. The median shelter cost of a specified group is the amount that divides the cost distribution of that group into two halves, i.e., the shelter costs of half of the households in that group are below the median, while those of the other half are above the median.
Figure 9 presents median monthly shelter costs among owner and renter households for Bruce County, Grey County, and Ontario in 2016. Median monthly costs were lower for renters than owners in Grey County and Ontario, and slightly lower in Bruce County.
Figure 9. Median Monthly Shelter Costs among Owner and Renter Households, Bruce County, Grey County, and Ontario, 2016
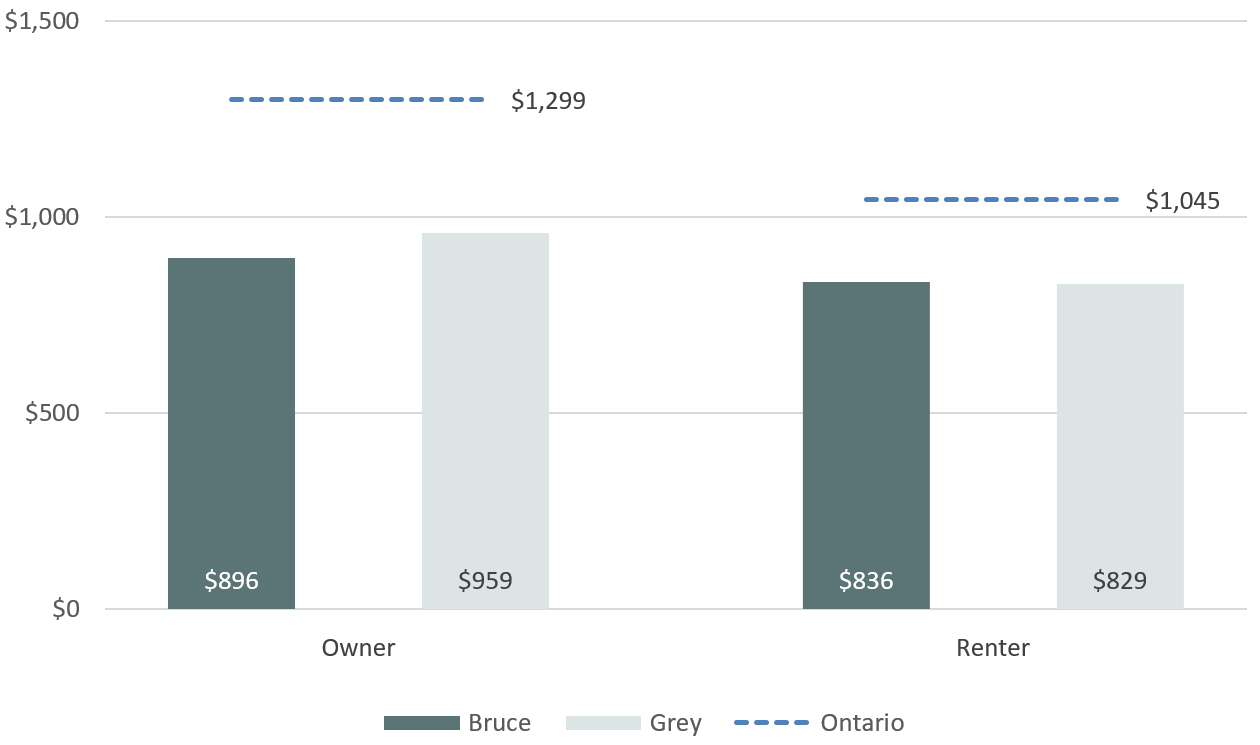
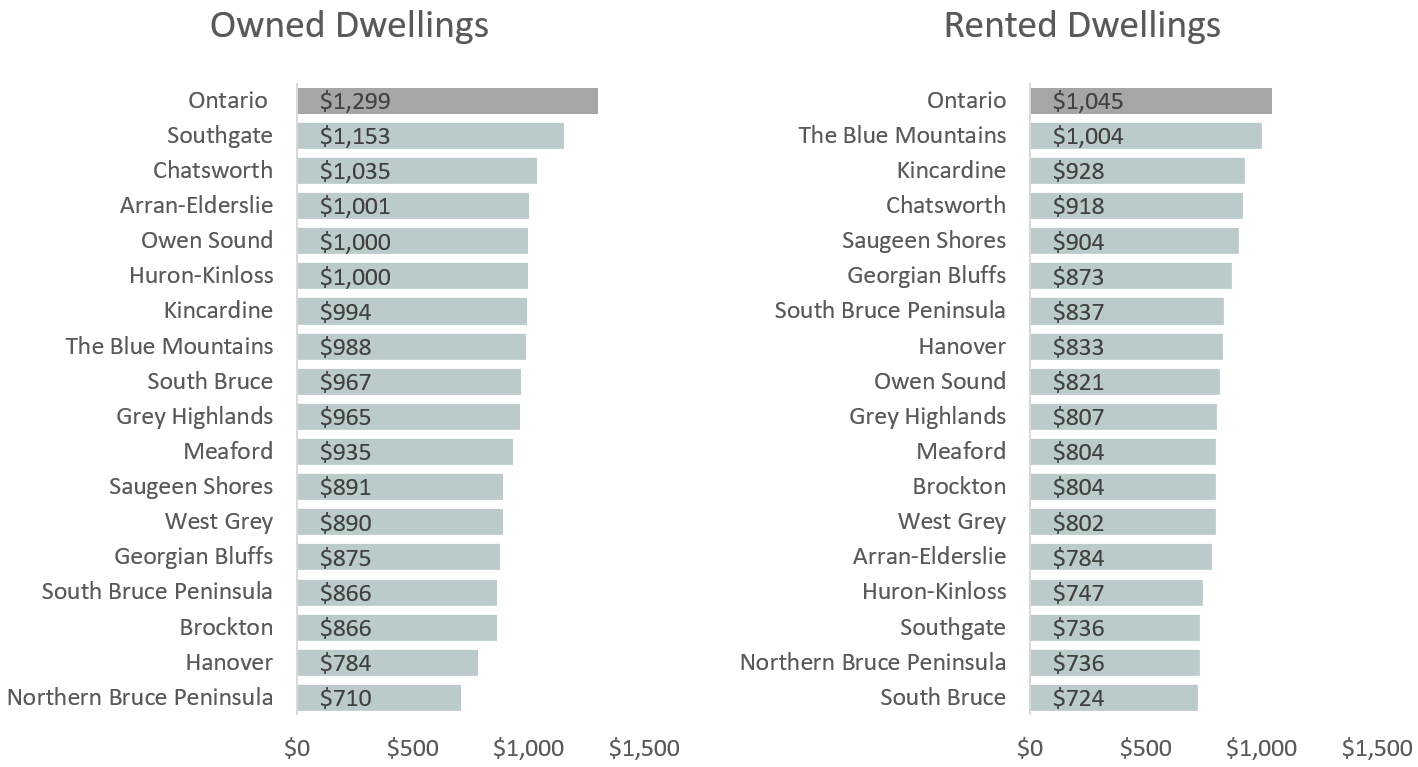
Figure 10 presents median monthly shelter costs among owner and renter households in Grey Bruce municipalities in 2016. Note that this only includes private dwellings that are not part of a farm, and are not located on a first nations reserve.
The median amount that owner households spent on monthly shelter costs was lower than the Ontario median in every municipality, as was the case with renter households. Median monthly shelter costs were higher for homeowners than for renters, except in Hanover, Northern Bruce Peninsula, The Blue Mountains, and Saugeen Shores, where median monthly shelter costs were higher for renters, and Georgian Bluffs where they were about the same.
Figure 10. Median Monthly Shelter Costs for Owner and Renter Households, Grey Bruce Municipalities, 2016
Housing Adequacy
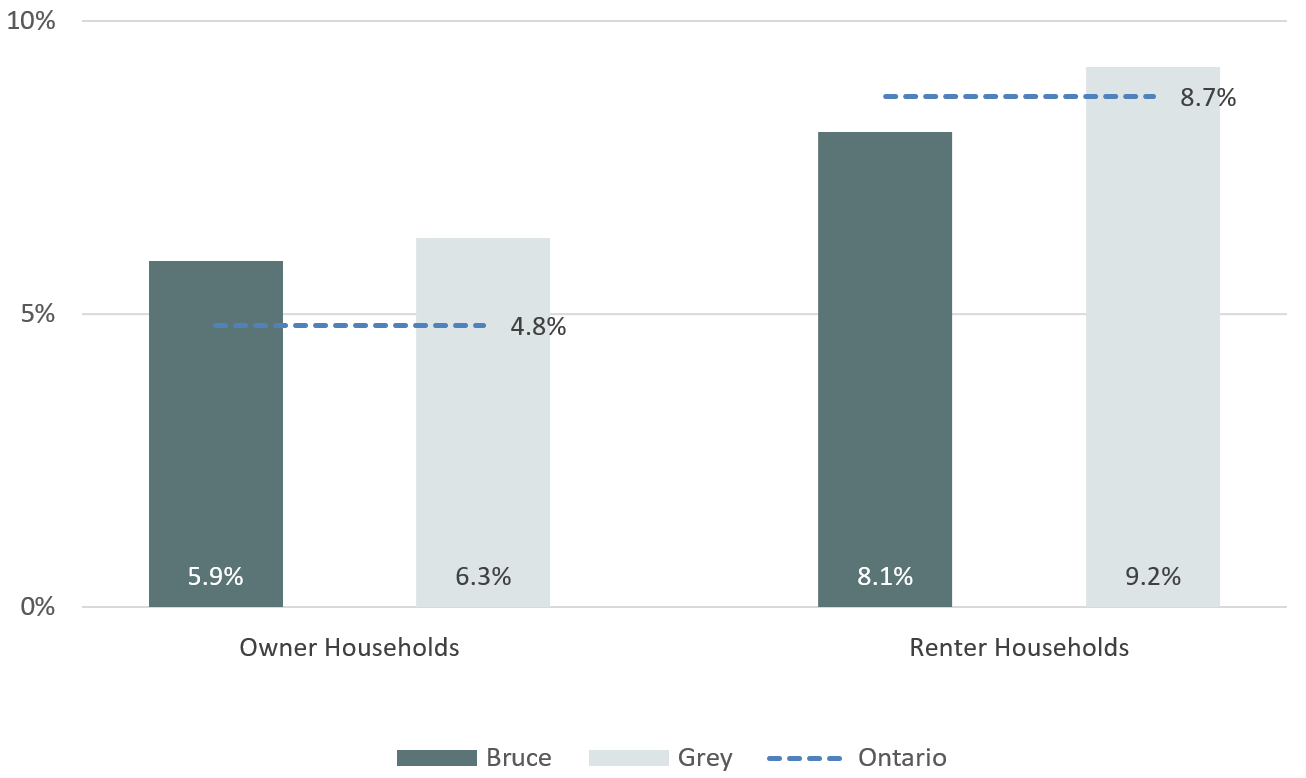
If a dwelling is in need of major repairs, this is considered an indicator of an inadequate dwelling by housing organizations. Table 2 presents the percentages of households living in private dwellings that fell below adequacy standards in Grey Bruce municipalities in 2006 and 2016, and whether the rate increased or decreased over that time period. Seven percent of households in both Bruce and Grey counties lived in dwellings that fell below adequacy standards, as did 6.1% of households in Ontario.
At the municipal level, most Grey Bruce municipalities had relatively more dwellings that fell below adequacy standards than Ontario. The municipalities with the highest rates of inadequate housing in 2016 were Southgate at 9.2%, Chatsworth at 9.0%, and Owen Sound at 7.9%. The rate of inadequate housing decreased in most areas, except Huron-Kinloss, The Blue Mountains, Georgian Bluffs, and Meaford.
Table 2. Percentage of Households in Dwellings below Adequacy Standards, Grey Bruce Municipalities 2006 and 2016
| |
Increase/ decrease
|
2006 (%)
|
2016 (%)
|
|
Ontario
|
|
6.6
|
6.1
|
|
Grey Bruce
|
n/a
|
*
|
7.0
|
|
Bruce
|
|
7.9
|
7.0
|
|
Arran-Elderslie
|
|
11.5
|
6.9
|
|
Brockton
|
|
7.5
|
7.4
|
|
Huron-Kinloss
|
|
7.1
|
7.6
|
|
Kincardine
|
|
6.0
|
6.0
|
|
N. Bruce Peninsula
|
n/a
|
*
|
7.0
|
|
Saugeen Shores
|
|
5.7
|
4.1
|
|
South Bruce
|
|
7.7
|
7.5
|
|
S. Bruce Peninsula
|
|
8.2
|
7.6
|
|
Grey
|
|
7.7
|
7.0
|
|
Blue Mountains
|
|
5.8
|
6.3
|
|
Chatsworth
|
|
9.5
|
9.0
|
|
Georgian Bluffs
|
|
5.9
|
6.0
|
|
Grey Highlands
|
|
8.7
|
6.9
|
|
Hanover
|
|
5.9
|
4.6
|
|
Meaford
|
|
6.5
|
6.6
|
|
Owen Sound
|
|
8.1
|
7.9
|
|
Southgate
|
|
11.3
|
9.2
|
|
West Grey
|
|
8.5
|
6.7
|
* Data not applicable or not available for this time period
Figure 11 presents the percentages of owner and renter households in private dwellings that fell below adequacy standards (needed major repairs) in 2016, in Bruce County, Grey County, and Ontario. Renter households were more likely than owner households to live in dwellings that fell below adequacy standards.
Figure 11. Percentage of Households in Dwellings below Adequacy Standards among Owner and Renter Households, Bruce County, Grey County, and Ontario 2016
Housing Suitability (“Crowding”)
The housing suitability indicator in the census measures what is commonly referred to as crowding. It classifies private dwellings as ‘not suitable’ if the dwelling does not have enough bedrooms for the size and composition of the household.
Table 3 presents the percentages of households living in private dwellings that fell below suitability standards (had too few bedrooms) in Grey Bruce municipalities in 2006 and 2016, and whether the rate increased or decreased over that time period. In 2016, Bruce and Grey counties had fewer crowded dwellings relative to Ontario, as did each Grey Bruce municipality. The municipalities with the highest proportions of households in crowded dwellings were South Bruce, West Grey, and Southgate. Since 2006, the rate of unsuitable housing has decreased in both counties and in every municipality.
Table 3. Percentage of Households in Crowded Dwellings, Grey Bruce Municipalities, 2006 and 2016
|
|
Increase/ decrease
|
2006
|
2016
|
|
Ontario
|
|
7.6
|
6.0
|
|
Grey Bruce
|
n/a
|
*
|
2.1
|
|
Bruce
|
|
2.8
|
1.8
|
|
Arran-Elderslie
|
|
4.0
|
1.1
|
|
Brockton
|
|
2.0
|
1.4
|
|
Huron-Kinloss
|
|
2.6
|
1.6
|
|
Kincardine
|
|
1.6
|
0.4
|
|
N. Bruce Peninsula
|
n/a
|
*
|
2.1
|
|
Saugeen Shores
|
|
1.5
|
1.4
|
|
South Bruce
|
|
4.6
|
3.4
|
|
S. Bruce Peninsula
|
|
3.6
|
2.5
|
|
Grey
|
|
3.1
|
2.3
|
|
Blue Mountains
|
|
1.7
|
1.5
|
|
Chatsworth
|
|
4.0
|
2.3
|
|
Georgian Bluffs
|
|
1.9
|
1.6
|
|
Grey Highlands
|
|
3.0
|
2.4
|
|
Hanover
|
|
3.1
|
2.5
|
|
Meaford
|
|
2.6
|
1.3
|
|
Owen Sound
|
|
3.5
|
2.5
|
|
Southgate
|
|
5.3
|
2.8
|
|
West Grey
|
|
3.3
|
3.1
|
* Data not applicable or not available for this time period
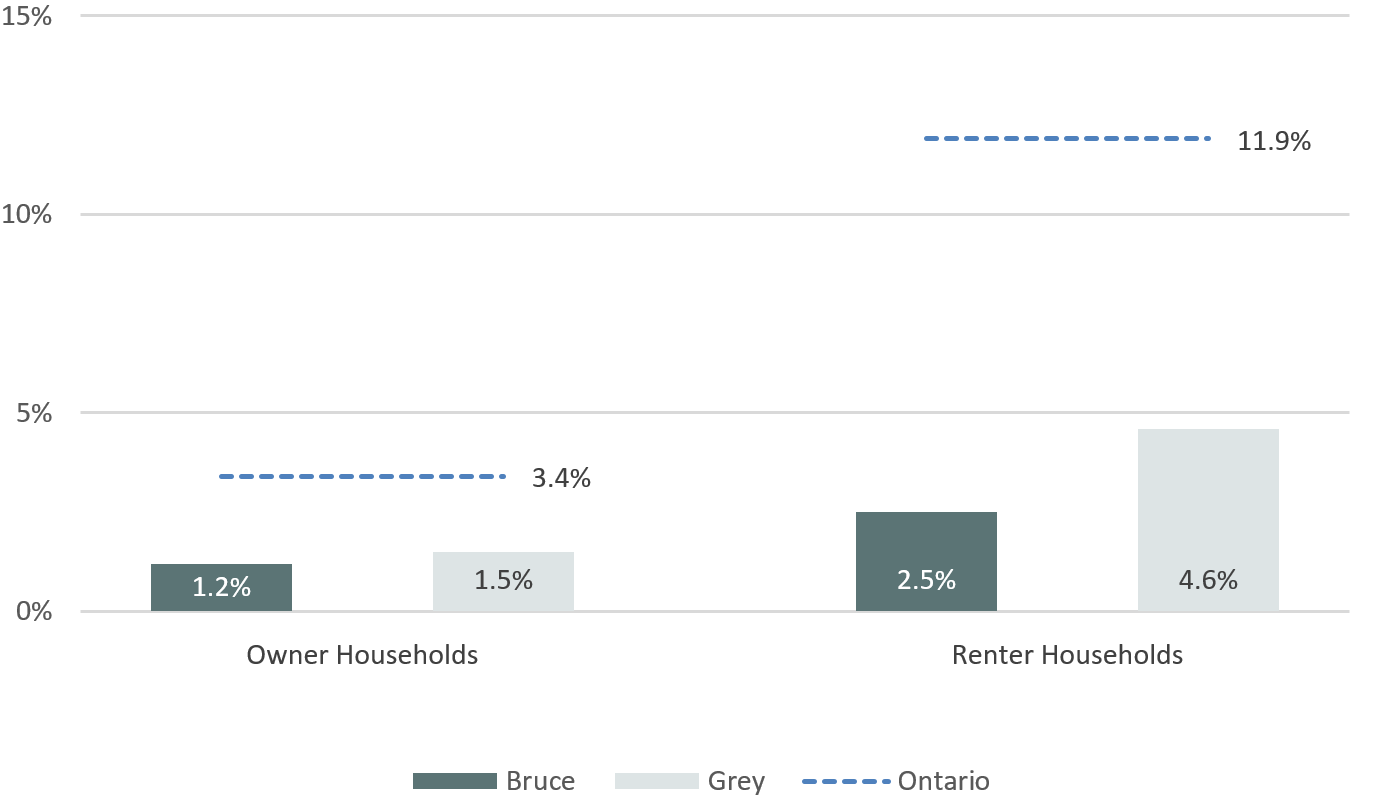
Figure 12 displays the percentages of owner and renter households in private dwellings that could be considered crowded in Bruce County, Grey County, and Ontario in 2016. Both renters and owners in Grey Bruce fared better than their provincial counterparts. As with other housing indicators, renters fared worse than owners both locally and provincially.
Figure 12. Percentage of Households in Dwellings below Suitability Standards, Bruce County, Grey County, and Ontario, 2016
Core Housing Need
Core housing need is the indicator used in Canada to identify households not living in, and not able to access acceptable housing. A household in core housing need is one whose dwelling is considered unsuitable (crowded), inadequate (requiring major repairs), or unaffordable (spending 30% or more of household income on shelter costs), and whose income levels are such that they could not afford alternative suitable and adequate housing in their community.
The percentage of households living in core housing need in Bruce County was 9.3% in 2016, relatively unchanged from 9.5% in 2006. In Grey County the percentage of households in core housing need increased slightly over the past ten years, from 10.3% in 2006 to 11.4% in 2016. Southgate experienced a dramatic increase in core housing need over this time period from 4.1% to 10.3%. The next largest increases were in The Blue Mountains, Chatsworth, and Arran-Elderslie.
Table 4. Percentage of Households in Core Housing Need, Grey Bruce Municipalities, 2006 and 2016
|
|
Increase/ decrease
|
2006
|
2016
|
|
Ontario
|
|
14.5
|
15.3
|
|
Bruce
|
|
9.5
|
9.3
|
|
Arran-Elderslie
|
|
10.9
|
14.4
|
|
Brockton
|
|
11.6
|
8.0
|
|
Huron-Kinloss
|
|
11.5
|
12.1
|
|
Kincardine
|
|
9.7
|
10.3
|
|
N. Bruce Peninsula
|
n/a
|
*
|
6.3
|
|
Saugeen Shores
|
|
9.1
|
8.0
|
|
South Bruce
|
|
7.8
|
6.1
|
|
S. Bruce Peninsula
|
|
7.3
|
9.4
|
|
Grey
|
|
10.3
|
11.4
|
|
Blue Mountains
|
|
6.8
|
10.0
|
|
Chatsworth
|
|
5.9
|
8.5
|
|
Georgian Bluffs
|
|
6.8
|
4.9
|
|
Grey Highlands
|
|
9.8
|
11.8
|
|
Hanover
|
|
13.7
|
15.5
|
|
Meaford
|
|
8.3
|
8.1
|
|
Owen Sound
|
|
16.6
|
17.7
|
|
Southgate
|
|
4.1
|
10.3
|
|
West Grey
|
|
7.8
|
7.4
|
Dwelling Value
Owner estimated value refers to the dollar amount expected by the owner if the asset were to be sold. The median dwelling value of a specified group is the amount that divides the dwelling value distribution of that group into two halves, i.e., the dwelling values of half of the dwellings in that group are below the median, while those of the other half are above the median.
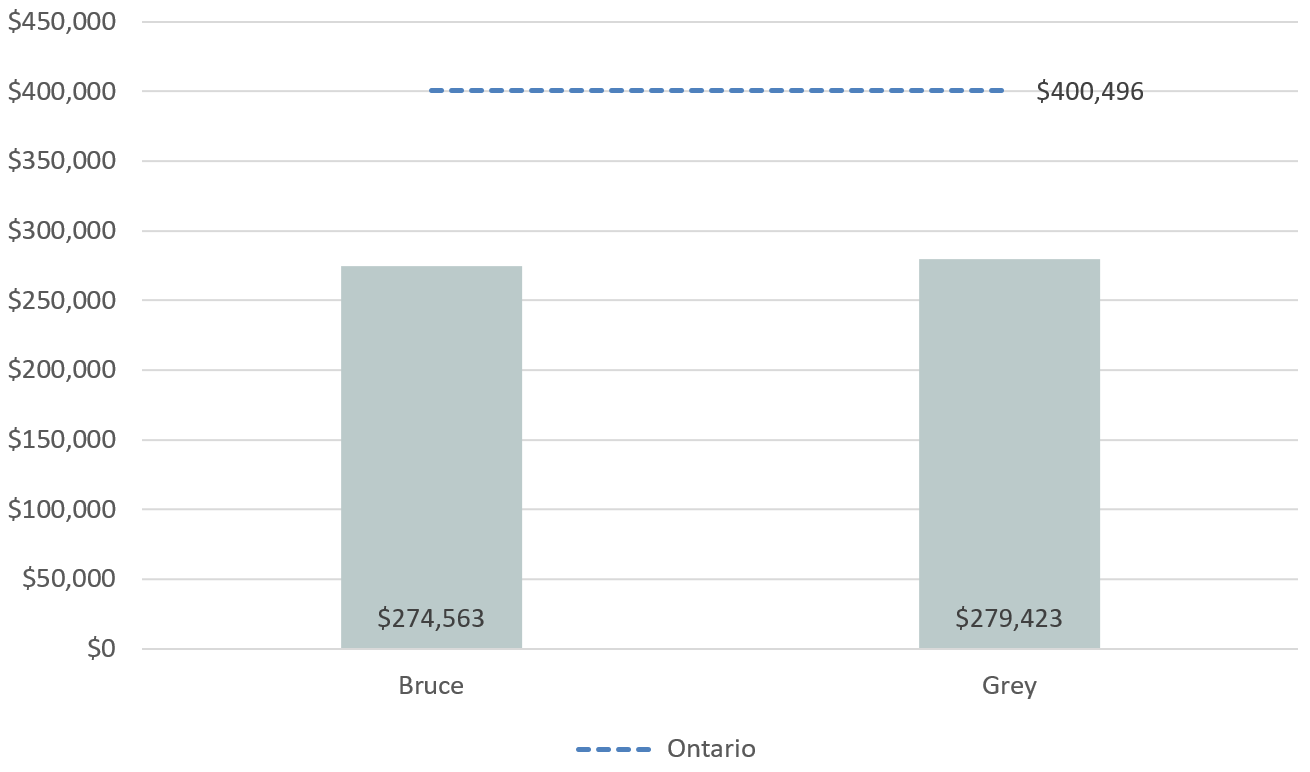
Figure 13 displays the median values of owned, non-farm, non-reserve private dwellings in Bruce County, Grey County, and Ontario in 2016. The median dwelling value in 2016 was $274,563 in Bruce County, and $279,423 in Grey County, substantially lower than Ontario at $400,496. The only municipality in Grey Bruce where the median dwelling value was higher than the provincial median was The Blue Mountains, where the median value was $500,370.
Figure 13. Median Dwelling Value, Bruce County, Grey County, and Ontario, 2016
Dwelling Type
Single-detached houses make up 83.7% of private occupied dwellings in Bruce County and 77.6% in Grey County, compared to only 54.3% in Ontario. See our full report for more details about dwelling types in Grey and Bruce counties and their municipalities.
Read the full report here: Census Release V Housing (Updated March 9)
References:
[1] Statistics Canada. 2006. Measuring Housing Affordability. http://www.statcan.gc.ca/pub/75-001-x/11106/9519-eng.pdf
Notes
Data specific to Neyaashiinigmiing and Saugeen First Nations are not included due to high non-response rates (24.9% and 37.8% respectively)
Data in this release are based on the short-form census which samples 25% of the population. Statistics Canada calculates estimates for the entire population based on this sample.
To ensure confidentiality, the values, including totals, are randomly rounded either up or down to a multiple of '5' or '10.' To understand these data, you must be aware that each individual value is rounded. A value of zero (-) does not necessarily mean that there are no people in that particular category.
Sources:
All content unless otherwise indicated: Statistics Canada. 2017. Various Geographies. Census Profile - Age, Sex, Type of Dwelling, Families, Households, Marital Status, Language, Income, Immigration and Ethnocultural Diversity, Housing, and Aboriginal Peoples for Canada, Provinces and Territories, Census Divisions and Census Subdivisions. 2016 Census. Statistics Canada Catalogue no. 98-401-X2016054. Ottawa. Released October 25, 2017 http://www12.statcan.gc.ca/census-recensement/2016/dp-pd/prof/details/download-telecharger/comp/page_dl-tc.cfm?Lang=E (accessed October 30, 2017).
Table 4: Statistics Canada, 2016 Census of Population, Catalogue no. 98-509-X2016001. http://www12.statcan.gc.ca/census-recensement/2016/dp-pd/chn-biml/index-eng.cfm
Figure 6: Statistics Canada, 2016 Census of Population, Catalogue no. 98-400-X2016229. http://www12.statcan.gc.ca/census-recensement/2016/dp-pd/dt-td/Rp-eng.cfm?LANG=E&APATH=3&DETAIL=0&DIM=0&FL=A&FREE=0&GC=0&GID=0&GK=0&GRP=1&PID=110573&PRID=10&PTYPE=109445&S=0&SHOWALL=0&SUB=0&Temporal=2017&THEME=121&VID=0&VNAMEE=&VNAMEF
Definitions: Statistics Canada, 2016. Dictionary, Census of Population 2016. http://www12.statcan.gc.ca/census-recensement/2016/ref/dict/index-eng.cfm