Children and Youth
Population (0-19 Years)
Youth Dependency Ratio (0-19 Years)
Low Income Rate (0-17 Years)
Family Structure (0-14 Years)
Immigration (0-14 Years)
Population (0-19 Years)
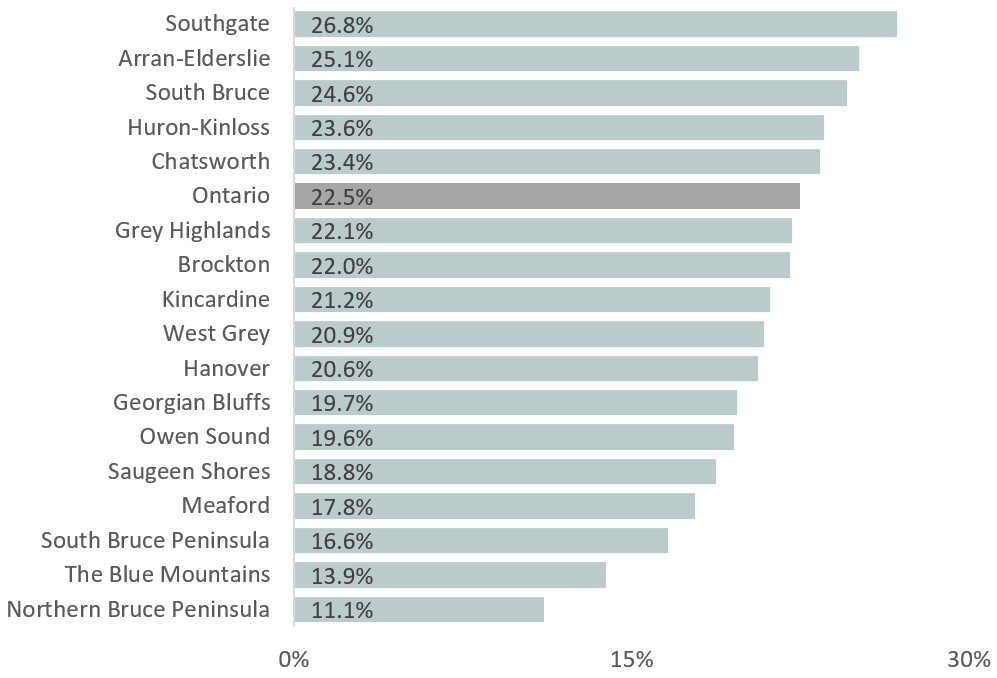
In 2016 there were 14,180 children and youth aged 0 to 19 living in Bruce County, and 19,060 in Grey County. Children and youth make up 20.8% of Bruce County’s population, and 20.3% of Grey County’s; both lower than the provincial proportion of 22.5%. Figure 1 displays the percentage of the population in each Grey Bruce municipality that is made up of children and youth aged 0 to 19. Children and youth make up a smaller percentage of the population in most Grey Bruce municipalities when compared to Ontario. The three municipalities where children and youth make up the highest percentage of the population are Southgate, Arran-Elderslie, and South Bruce. See Table 1 for a more detailed breakdown by age at the municipal level.
Figure 1. Percentage of the Population Aged 0 to 19, Grey Bruce Municipalities, 2016

Table 1. Population Aged 0 to 19, Grey Bruce Municipalities, 2016
|
Geography (population)
|
0 - 19 years (%)
|
0 - 4 years (%)
|
5 - 9 years (%)
|
10 - 14 years (%)
|
15 - 19 years (%)
|
|
Ontario (13,448,495)
|
3,019,645 (22.5)
|
697,360 (5.2)
|
756,085 (5.6)
|
754,530 (5.6)
|
811,670 (6.0)
|
|
Grey Bruce (161,975)
|
33,240 (20.5)
|
8,310 (5.1)
|
8,305 (5.1)
|
8,045 (5.0)
|
8,580 (5.3)
|
|
Bruce (68,145)
|
14,180 (20.8)
|
3,790 (5.6)
|
3,645 (5.3)
|
3,335 (4.9)
|
3,410 (5.0)
|
|
Arran-Elderslie (6,805)
|
1,710 (25.1)
|
470 (6.9)
|
490 (7.2)
|
380 (5.6)
|
370 (5.4)
|
|
Brockton (9,460)
|
2,085 (22.0)
|
555 (5.9)
|
525 (5.5)
|
505 (5.3)
|
500 (5.3)
|
|
Huron-Kinloss (7,070)
|
1,665 (23.6)
|
470 (6.6)
|
440 (6.2)
|
375 (5.3)
|
380 (5.4)
|
|
Kincardine (11,385)
|
2,410 (21.2)
|
665 (5.8)
|
600 (5.3)
|
580 (5.1)
|
565 (5.0)
|
|
N. Bruce Peninsula (4,000)
|
445 (11.1)
|
95 (2.4)
|
125 (3.1)
|
105 (2.6)
|
120 (3.0)
|
|
Saugeen Shores (13,715)
|
2,575 (18.8)
|
730 (5.3)
|
655 (4.8)
|
595 (4.3)
|
595 (4.3)
|
|
S. Bruce Peninsula (8,415)
|
1,400 (16.6)
|
325 (3.9)
|
350 (4.2)
|
345 (4.1)
|
380 (4.5)
|
|
South Bruce (5,635)
|
1,385 (24.6)
|
345 (6.1)
|
330 (5.9)
|
345 (6.1)
|
365 (6.5)
|
|
Grey (93,830)
|
19,060 (20.3)
|
4,520 (4.8)
|
4,660 (5.0)
|
4,710 (5.0)
|
5,170 (5.5)
|
|
The Blue Mountains (7,025)
|
975 (13.9)
|
200 (2.8)
|
220 (3.1)
|
240 (3.4)
|
315 (4.5)
|
|
Chatsworth (6,630)
|
1,550 (23.4)
|
375 (5.7)
|
355 (5.4)
|
385 (5.8)
|
435 (6.6)
|
|
Georgian Bluffs (10,480)
|
2,065 (19.7)
|
440 (4.2)
|
500 (4.8)
|
525 (5)
|
600 (5.7)
|
|
Grey Highlands (9,805)
|
2,170 (22.1)
|
530 (5.4)
|
565 (5.8)
|
505 (5.2)
|
570 (5.8)
|
|
Hanover (7,690)
|
1,585 (20.6)
|
350 (4.6)
|
415 (5.4)
|
420 (5.5)
|
400 (5.2)
|
|
Meaford (10,990)
|
1,960 (17.8)
|
485 (4.4)
|
490 (4.5)
|
455 (4.1)
|
530 (4.8)
|
|
Owen Sound (21,340)
|
4,175 (19.6)
|
1,040 (4.9)
|
1,025 (4.8)
|
1,010 (4.7)
|
1,100 (5.2)
|
|
Southgate (7,355)
|
1,970 (26.8)
|
515 (7.0)
|
455 (6.2)
|
485 (6.6)
|
515 (7.0)
|
|
West Grey (12,520)
|
2,615 (20.9)
|
590 (4.7)
|
625 (5.0)
|
690 (5.5)
|
710 (5.7)
|
Youth Dependency Ratio (0-19 Years)
The youth demographic dependency ratio is the ratio of the youth population (0 to 19 years) to the working-age population (20 to 64 years). [1] It is expressed as the number of "dependents" for every 100 "workers". The demographic dependency ratio is based on age rather than employment status, and does not account for young people or seniors who are working, nor for working-age people who are unemployed or not in the labour force. [1] It merely reflects population age structure and is not meant to diminish the contributions made by people classified as "dependents." [1]
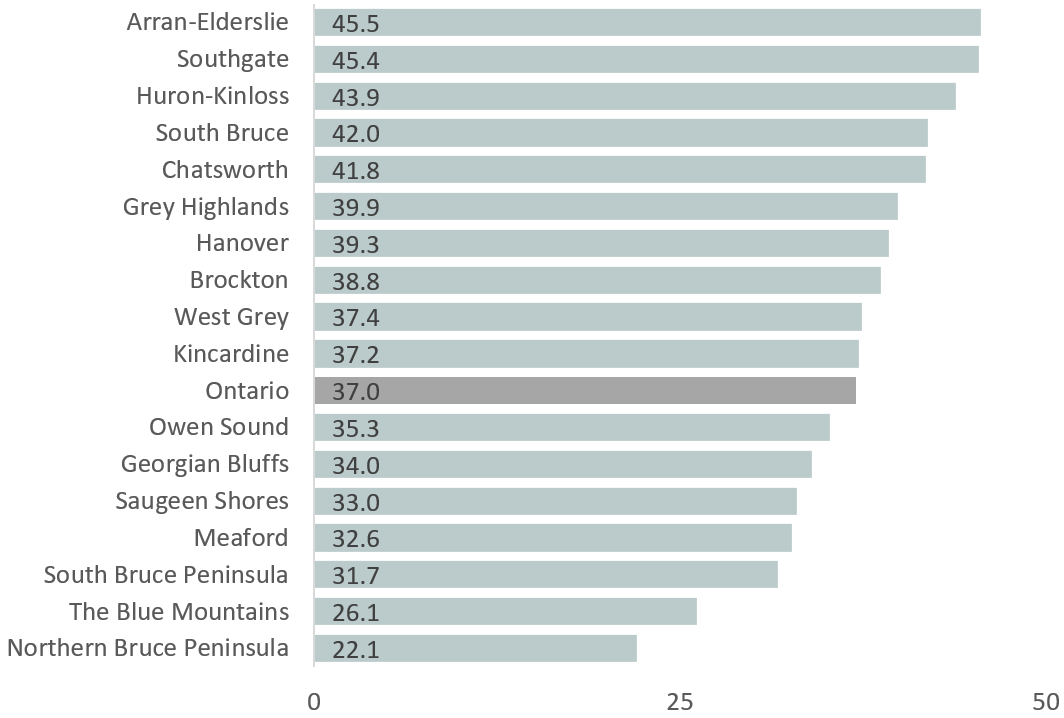
In Ontario in 2016, there were 37 children and youth aged 0-19 for every 100 “working-aged” adults, aged 20 through 64. Bruce and Grey counties had the same ratio of youths to working-aged adults as Ontario, at 37 youths for every 100 working-aged adults. This has decreased locally and provincially since 2006, from 40.8 in Ontario, 40 in Bruce County, and 40.9 in Grey County. Figure 2 displays the number of children and youth per 100 working-aged adults in Grey Bruce municipalities in 2016. This varied widely, from 22 in Northern Bruce Peninsula to 45 in Arran-Elderslie and Southgate.
Figure 2. Number of Children and Youth (Aged 0-19) per 100 Working-aged Adults (Aged 20-64), Grey Bruce Municipalities, 2016

Low Income Rate (0-17 Years)
According to the low income measures, after-tax (LIM-AT), a household has low income if its after-tax income is less than half of the median after-tax income of all households in Canada. The LIM is adjusted for household size because a household's needs increase as the number of members increases.
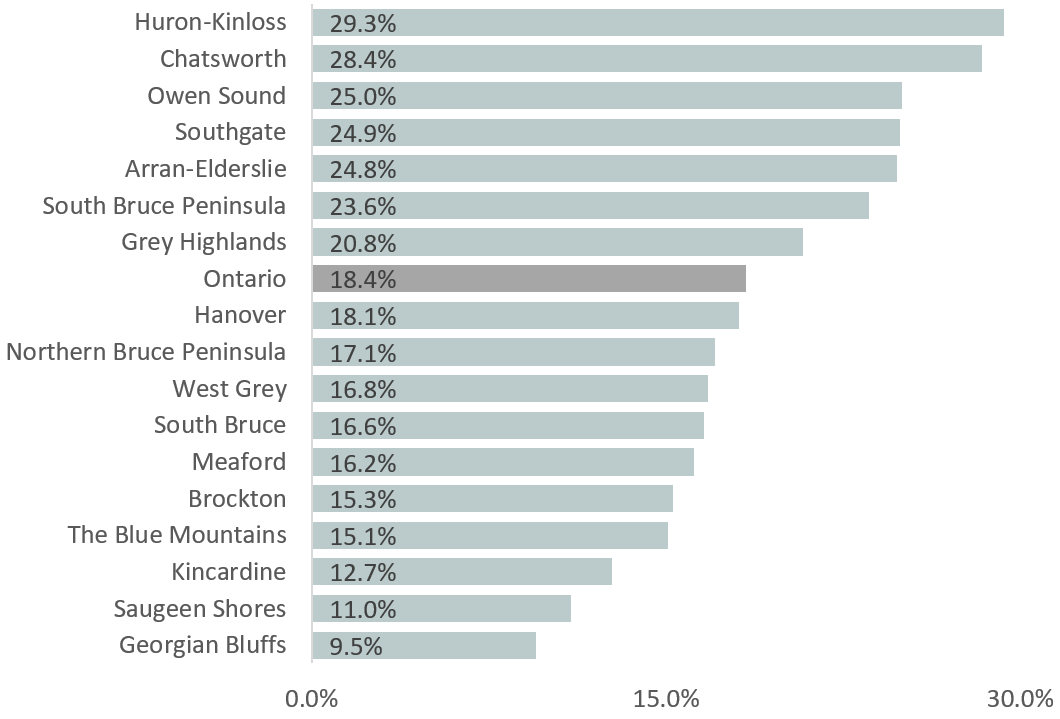
In 2015, 18.4% of children and youth aged 0 to 17 in Ontario lived in low-income households, according to the LIM-AT. The low-income rate among children and youth was slightly lower than Ontario in Bruce County, at 17.9% and higher in Grey County, at 20.0%. Figure 3 displays the percentage of children and youth under 18 living in low-income households in Grey Bruce municipalities in 2015. About half of Grey Bruce municipalities had more children and youth in low-income households relative to Ontario. The highest low income rates among children and youth were found in Huron-Kinloss, Chatsworth, Owen Sound, Southgate, and Arran-Elderslie, where around one quarter of children and youth lived in low-income households. Table 2 displays the number of children living in low-income households in Grey Bruce municipalities, along with the percentage of their age group that they represent. In most municipalities, children under 5 are more likely to belong to low-income households than children under 17.
Figure 3. Percentage of Children Aged 0-17 in Low-income Households, According to LIM-AT, Grey Bruce Municipalities, 2015

Table 2. Children in Low-income Households, According to LIM-AT, Grey Bruce Municipalities, 2015
|
Geography
|
Aged 0 to 5 (%)
|
Aged 0 to 17 (%)
|
|
Ontario
|
165,140 (19.8)
|
489,905 (18.4)
|
|
Grey Bruce
|
2,185 (22.2)
|
5,580 (19.2)
|
|
Bruce
|
845 (19.4)
|
2,205 (17.9)
|
|
Arran-Elderslie
|
160 (28.1)
|
390 (24.8)
|
|
Brockton
|
100 (15.3)
|
290 (15.3)
|
|
Huron-Kinloss
|
200 (36.0)
|
440 (29.3)
|
|
Kincardine
|
110 (13.9)
|
275 (12.7)
|
|
N. Bruce Peninsula
|
15 (13.0)
|
65 (17.1)
|
|
Saugeen Shores
|
90 (10.5)
|
255 (11.0)
|
|
South Bruce
|
65 (15.7)
|
205 (16.6)
|
|
S. Bruce Peninsula
|
110 (28.6)
|
295 (23.6)
|
|
Grey
|
1,340 (24.5)
|
3,375 (20.0)
|
|
Blue Mountains
|
55 (22.4)
|
125 (15.1)
|
|
Chatsworth
|
155 (34.4)
|
390 (28.4)
|
|
Grey Highlands
|
165 (26.0)
|
400 (20.8)
|
|
Georgian Bluffs
|
50 (9.1)
|
170 (9.5)
|
|
Hanover
|
95 (21.8)
|
255 (18.1)
|
|
Meaford
|
115 (19.7)
|
280 (16.2)
|
|
Owen Sound
|
360 (29.0)
|
925 (25.0)
|
|
Southgate
|
195 (31.5)
|
440 (24.9)
|
|
West Grey
|
150 (21.0)
|
390 (16.8)
|
Children’s Family Structure (0-14 Years)
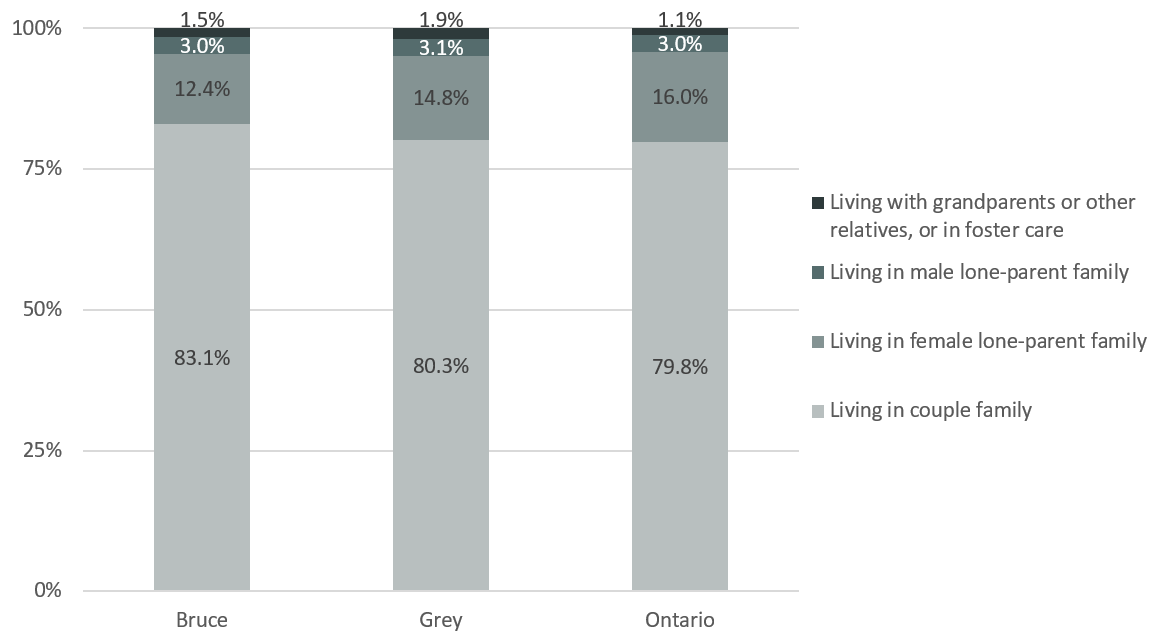
Figure 4 presents children aged 14 and under by family structure. In 2016, 83.1% of children 14 and under in Bruce County and 80.3% in Grey county were living in a couple family (either with two biological/adoptive parents, or one biological/adoptive parent and one step-parent). Children living in a female-headed lone-parent family made up 12.4% of children in Bruce County and 14.8% in Grey County, while children living in a male-headed lone-parent family made up 3.0% of children in Bruce County and 3.1% in Grey County. Children who were living with one or more grandparent (without parents present), living with other relatives, or who were living in a foster family made up 1.5% of children in Bruce County and 1.9% in Grey County.
Figure 4. Children 14 and Under by Family Structure, Bruce County, Grey County & Ontario, 2016

Immigration (0-14 Years)
Canada’s immigrant population is defined as persons who are, or who have been, landed immigrants a.k.a. permanent residents in Canada. A landed immigrant is not a Canadian citizen by birth, but has been granted the right to live in Canada permanently by immigration authorities. Refugees, students, and those with work permits or Minister’s permits are not landed immigrants, but non-permanent residents. Non-permanent residents are persons from another country who have a work or study permit or who are refugee claimants, along with their family members sharing the same permit and living in Canada with them.
Table 3 displays the immigrant status of children aged 0 to 14 in Ontario, Bruce County, and Grey County in 2016. Immigrants and non-permanent residents made up a small percentage of the population aged 0 to 14 in both Bruce and Grey counties in 2016. As is the case in other age groups, the percentage of 0 to 14 year olds in Grey Bruce who were or had ever been landed immigrants or non-permanent residents was lower than the Ontario percentage.
Table 3. Immigrant Status of Children (0-14), Ontario, Bruce County, and Grey County, 2016
|
|
Geography (population aged 0 to 14)
|
|
Immigrant Status
|
Ontario (2,203,720)
|
Grey Bruce (24,590)
|
Bruce (10,750)
|
Grey (13,840)
|
|
Non-immigrants (%)
|
2,037,710 (92.5)
|
24,310 (98.9)
|
10,620 (98.8)
|
13,690 (98.9)
|
|
Immigrants (%)
|
147,320 (6.7)
|
255 (1.0)
|
120 (1.1)
|
135 (1.0)
|
|
Non-permanent Residents (%)
|
18,690 (0.8)
|
25 (0.1)
|
15 (0.1)
|
10 (0.1)
|
Read the full report here: Children and Youth in Grey Bruce
References
[1] Statistics Canada. 2010. Demographic Change. Healthy People, Healthy Places, Statistics Canada Catalogue no. 82-229-X. Ottawa. https://www.statcan.gc.ca/pub/82-229-x/2009001/demo/dep-eng.htm#shr-pg-pnl6. Published Jan 11, 2010. Accessed March 5, 2017.
Data specific to Neyaashiinigmiing and Saugeen First Nations are not presented due to high non-response rates
To ensure confidentiality, the values, including totals, are randomly rounded either up or down to a multiple of '5' or '10.' To understand these data, you must be aware that each individual value is rounded. A value of zero (-) does not necessarily mean that there are no people in that particular category.
Sources:
Population: Statistics Canada. 2017. Various Geographies. Census Profile. 2016 Census. Statistics Canada Catalogue no. 98-316-X2016001. Ottawa. Released May 3, 2017. http://www12.statcan.gc.ca/census-recensement/2016/dp-pd/prof/index.cfm?Lang=E (accessed May 5, 2017).
Low Income Rate: Statistics Canada. 2017. Various Geographies. Census Profile - Age, Sex, Type of Dwelling, Families, Households, Marital Status, Language and Income for Canada, Provinces and Territories, Census Divisions and Census Subdivisions. 2016 Census. Statistics Canada Catalogue no. 98-401-X2016052. Ottawa. Released Sept 13, 2017. http://www5.statcan.gc.ca/olc-cel/olc.action?objId=98-401-X2016053&objType=46&lang=en&limit=0 (accessed Sept 13 2017).
Family structure: Statistics Canada, 2016 Census of Population, Statistics Canada Catalogue no. 98-400-X2016041. http://www12.statcan.gc.ca/census-recensement/2016/dp-pd/dt-td/Rp-eng.cfm?TABID=2&LANG=E&A=R&APATH=3&DETAIL=0&DIM=0&FL=A&FREE=0&GC=01&GL=-1&GID=1159582&GK=1&GRP=1&O=D&PID=109660&PRID=10&PTYPE=109445&S=0&SHOWALL=0&SUB=0&Temporal=2016&THEME=117&VID=0&VNAMEE=&VNAMEF=&D1=0&D2=0&D3=0&D4=0&D5=0&D6=0
Immigration: Source: Statistics Canada, 2016 Census of Population, Statistics Canada Catalogue no. 98-400-X2016185. http://www12.statcan.gc.ca/census-recensement/2016/dp-pd/dt-td/Rp-eng.cfm?TABID=1&LANG=E&A=R&APATH=3&DETAIL=0&DIM=0&FL=A&FREE=0&GC=01&GL=-1&GID=1257309&GK=1&GRP=1&O=D&PID=110526&PRID=10&PTYPE=109445&S=0&SHOWALL=0&SUB=0&Temporal=2017&THEME=120&VID=0&VNAMEE=&VNAMEF=&D1=0&D2=0&D3=0&D4=0&D5=0&D6=0
Definitions: Statistics Canada, 2016. Dictionary, Census of Population 2016. http://www12.statcan.gc.ca/census-recensement/2016/ref/dict/index-eng.cfm