Older Adults
Population
Older Adult Dependency Ratio
Marital Status
Household Type
Low Income Rate
Housing
Immigration
Projected Senior Population
Read the full report here: Older Adults in Grey Bruce
Note: this page was updated on January 30, 2020 to correct data in Figures 2 and 3.
Population
Figure 1 displays the percentages of the population aged 65 years and older and 85 years and older in Bruce and Grey counties and Ontario, in 2016. There were 22,630 older adults aged 65 years and older living in Grey County in 2016, and 16,075 in Bruce County. Older adults made up 23.6% of Bruce County’s population, and 24.1% of Grey County’s; both higher than the provincial percentage of 16.7%. Looking only at older adults aged 85+, Grey Bruce percentages were similar to Ontario. There were 1,850 older adults 85+ in Bruce County in 2016, and 2,980 in Grey County.
Figure 1. Percentage of the Population Aged 65+ and 85+, Bruce County, Grey County and Ontario, 2016
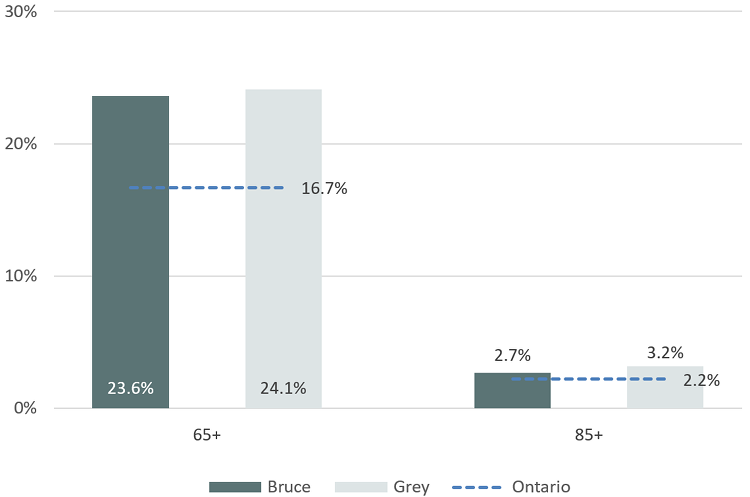
Figure 2 displays the percentage of the population that is made up of older adults aged 65 years and older in each Grey Bruce municipality. Older adults aged 65+ made up a larger percentage of the population in almost every Grey Bruce municipality when compared to Ontario, with Southgate being the only exception. The three municipalities where older adults aged 65+ made up the highest percentage of the population were Northern Bruce Peninsula, The Blue Mountains, and South Bruce Peninsula.
Figure 2. Percentage of the Population Aged 65+, Grey Bruce Municipalities, 2016
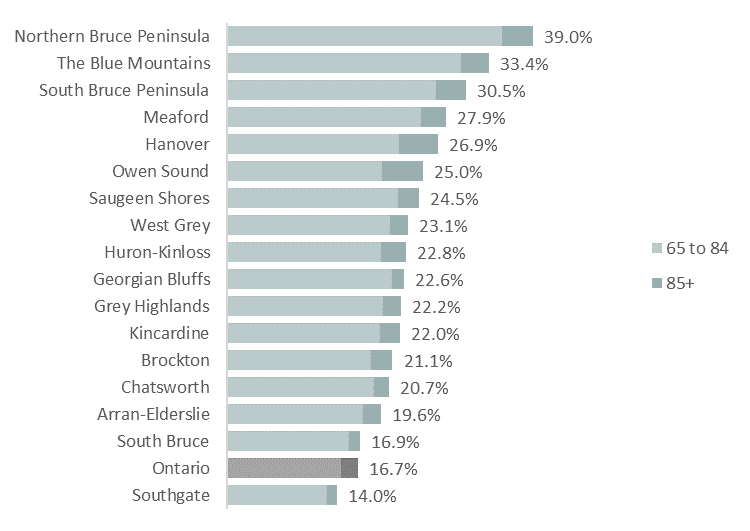
Figure 3 presents the number of older adults aged 65-84, and 85+ residing in Grey Bruce municipalities in 2016. Almost 30% of older adults aged 85+ in Grey Bruce lived in Owen Sound. See Table 2 and Table 3 below for detailed population counts at the municipal level.
Figure 3. Number of Older Adults Aged 65-84 and 85+, Grey Bruce Municipalities, 2016
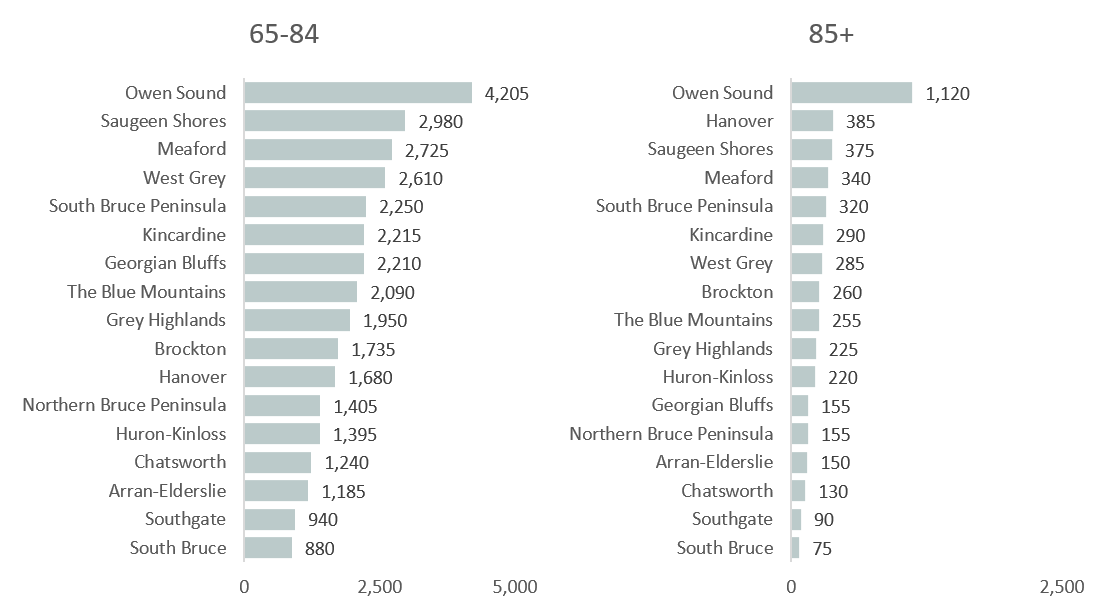
Table 1. Older Adult Population, Grey Bruce Municipalities, 2016
|
Geography (population)
|
65 +
|
65 to 69
|
70 to 79
|
|
Ontario (13,448,495)
|
2,251,655 (16.7)
|
737,745 (5.5)
|
921,655 (6.9)
|
|
Grey Bruce (161,975)
|
38,705 (23.9)
|
12,945 (8.0)
|
16,015 (9.9)
|
|
Bruce (68,145)
|
16,075 (23.6)
|
5,500 (8.1)
|
6,710 (9.8)
|
|
Arran-Elderslie (6,805)
|
1,335 (19.6)
|
450 (6.6)
|
555 (8.2)
|
|
Brockton (9,460)
|
1,995 (21.1)
|
655 (6.9)
|
825 (8.7)
|
|
Huron-Kinloss (7,070)
|
1,615 (22.8)
|
575 (8.1)
|
645 (9.1)
|
|
Kincardine (11,385)
|
2,505 (22.0)
|
860 (7.6)
|
1,025 (9.0)
|
|
N. Bruce Peninsula (4,000)
|
1,560 (39.0)
|
535 (13.4)
|
675 (16.9)
|
|
Saugeen Shores (13,715)
|
3,355 (24.5)
|
1,155 (8.4)
|
1,395 (10.2)
|
|
South Bruce (5,635)
|
955 (16.9)
|
350 (6.2)
|
395 (7.0)
|
|
S. Bruce Peninsula (8,415)
|
2,570 (30.5)
|
840 (10.0)
|
1,125 (13.4)
|
|
Grey (93,830)
|
22,630 (24.1)
|
7,445 (7.9)
|
9,305 (9.9)
|
|
Blue Mountains (7,025)
|
2,345 (33.4)
|
790 (11.2)
|
1,020 (14.5)
|
|
Chatsworth (6,630)
|
1,370 (20.7)
|
555 (8.4)
|
560 (8.4)
|
|
Georgian Bluffs (10,480)
|
2,365 (22.6)
|
930 (8.9)
|
1,055 (10.1)
|
|
Grey Highlands (9,805)
|
2,175 (22.2)
|
705 (7.2)
|
975 (9.9)
|
|
Hanover (7,690)
|
2,065 (26.9)
|
555 (7.2)
|
795 (10.3)
|
|
Meaford (10,990)
|
3,065 (27.9)
|
1,060 (9.6)
|
1,295 (11.8)
|
|
Owen Sound (21,340)
|
5,325 (25.0)
|
1,410 (6.6)
|
1,935 (9.1)
|
|
Southgate (7,355)
|
1,030 (14.0)
|
375 (5.1)
|
445 (6.1)
|
|
West Grey (12,520)
|
2,895 (23.1)
|
1,070 (8.5)
|
1,230 (9.8)
|
Table 2. Older Adult Population (continued), Grey Bruce Municipalities, 2016
|
Geography (population)
|
85+
|
80 to 89
|
90 to 99
|
100 +
|
|
Ontario (13,448,495)
|
301,075 (2.2)
|
479,655 (3.6)
|
109,600 (0.66)
|
3,005 (0.02)
|
|
Grey Bruce (161,975)
|
4,830 (3.0)
|
8,000 (4.9)
|
1,685 (0.86)
|
60 (0.04)
|
|
Bruce (68,145)
|
1,850 (2.7)
|
3,195 (4.7)
|
650 (0.80)
|
25 (0.04)
|
|
Arran-Elderslie (6,805)
|
150 (2.2)
|
255 (3.7)
|
60 (0.73)
|
-
|
|
Brockton (9,460)
|
260 (2.7)
|
425 (4.5)
|
95 (0.79)
|
5 (0.05)
|
|
Huron-Kinloss (7,070)
|
220 (3.1)
|
325 (4.6)
|
70 (0.92)
|
5 (0.07)
|
|
Kincardine (11,385)
|
290 (2.5)
|
505 (4.4)
|
110 (0.75)
|
5 (0.04)
|
|
N. Bruce Peninsula (4,000)
|
155 (3.9)
|
295 (7.4)
|
55 (1.25)
|
5 (0.13)
|
|
Saugeen Shores (13,715)
|
375 (2.7)
|
675 (4.9)
|
135 (0.84)
|
-
|
|
South Bruce (5,635)
|
75 (1.3)
|
190 (3.4)
|
20 (0.35)
|
-
|
|
S. Bruce Peninsula (8,415)
|
320 (3.8)
|
490 (5.8)
|
110 (1.01)
|
5 (0.06)
|
|
Grey (93,830)
|
2,980 (3.2)
|
4,805 (5.1)
|
1,035 (0.90)
|
35 (0.04)
|
|
Blue Mountains (7,025)
|
255 (3.6)
|
455 (6.5)
|
90 (1.14)
|
5 (0.07)
|
|
Chatsworth (6,630)
|
130 (2.0)
|
210 (3.2)
|
40 (0.45)
|
-
|
|
Georgian Bluffs (10,480)
|
155 (1.5)
|
330 (3.1)
|
55 (0.43)
|
-
|
|
Grey Highlands (9,805)
|
225 (2.3)
|
425 (4.3)
|
75 (0.66)
|
5 (0.05)
|
|
Hanover (7,690)
|
385 (5.0)
|
580 (7.5)
|
135 (1.43)
|
10 (0.13)
|
|
Meaford (10,990)
|
340 (3.1)
|
575 (5.2)
|
115 (0.86)
|
10 (0.09)
|
|
Owen Sound (21,340)
|
1,120 (5.2)
|
1,540 (7.2)
|
420 (1.52)
|
15 (0.07)
|
|
Southgate (7,355)
|
90 (1.2)
|
195 (2.7)
|
25 (0.27)
|
-
|
|
West Grey (12,520)
|
285 (2.3)
|
505 (4.0)
|
90 (0.56)
|
-
|
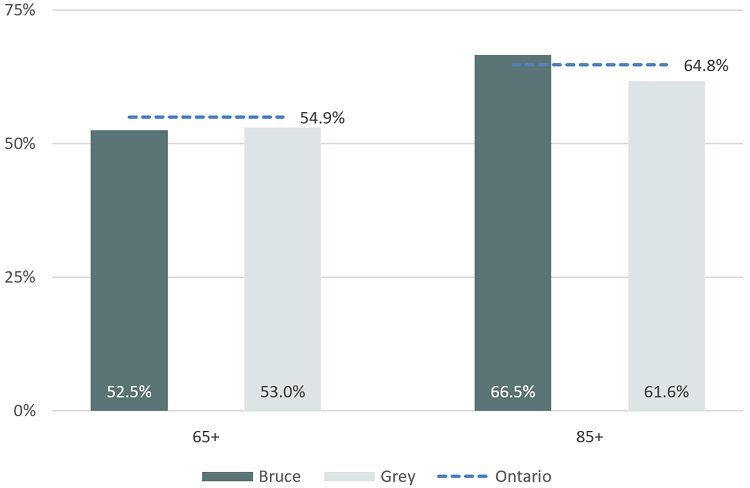
Women, on average, live longer than men. Figure 4 displays the percentages of the populations aged 65+, and aged 85+ that were made up of women in 2016. Women made up a slightly higher percentage of the 65+ population than men in Bruce and Grey counties and Ontario. Women made up even more of the population aged 85 years and older; 66.5% of those aged 85+ in Bruce County were women, as were 61.6% in Grey County, and 64.8% in Ontario.
Figure 4. Percentage of Older Adults Aged 65+ and 85+ Who Are Women, Bruce County, Grey County and Ontario, 2016
Older Adult Dependency Ratio
The older adult demographic dependency ratio is the ratio of the older adult population (65 years and older) to the working-age population (20 to 64 years). [1] It is expressed as the number of "dependents" for every 100 "workers". The demographic dependency ratio is based on age rather than employment status, and does not account for young people or seniors who are working, nor for working-age people who are unemployed or not in the labour force. [1] It merely reflects population age structure and is not meant to diminish the contributions made by people classified as "dependents." [1]
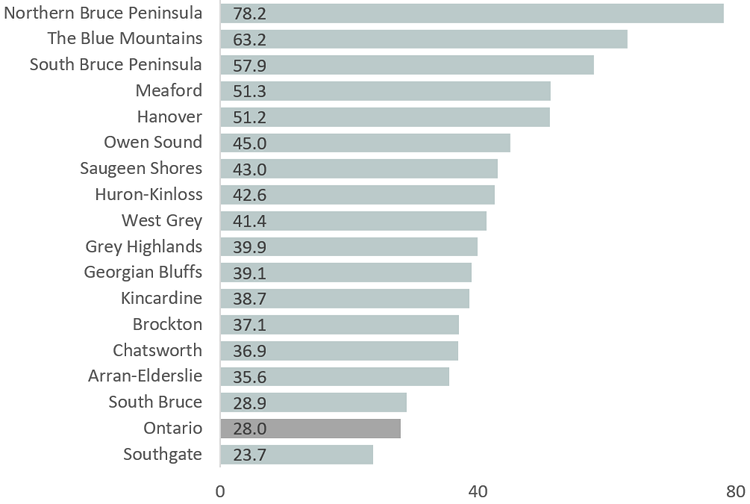
In Ontario in 2016, there were 28 older adults aged 65 and older for every 100 “working-aged” adults, aged 20 through 64. Bruce and Grey counties had more older adults per 100 working-age adults than Ontario, at 42 older adults for every 100 working-age adults in Bruce County, and 43 in Grey County. This has increased locally and provincially since 2006, from 22 in Ontario, 31.5 in Bruce County, and 32.4 in Grey County. Figure 5 displays the number of older adults per 100 working-age adults in Grey Bruce municipalities in 2016. Every municipality in Grey Bruce had more older adults per 100 working-aged adults than Ontario, except Southgate.
Figure 5. Number of Older Adults (Aged 65+) per 100 Working-aged Adults (Aged 20-64), Grey Bruce Municipalities, 2016
Marital Status
Table 3 presents the marital status (partnered vs. not partnered) of older adults aged 65 years and older in Bruce County, Grey County, and Ontario in 2016. ‘Partnered’ people include those who are married or living common law (living with a person as a couple but not legally married to that person). ‘Not partnered’ includes people who have never been married, and people who are divorced, separated, or widowed.
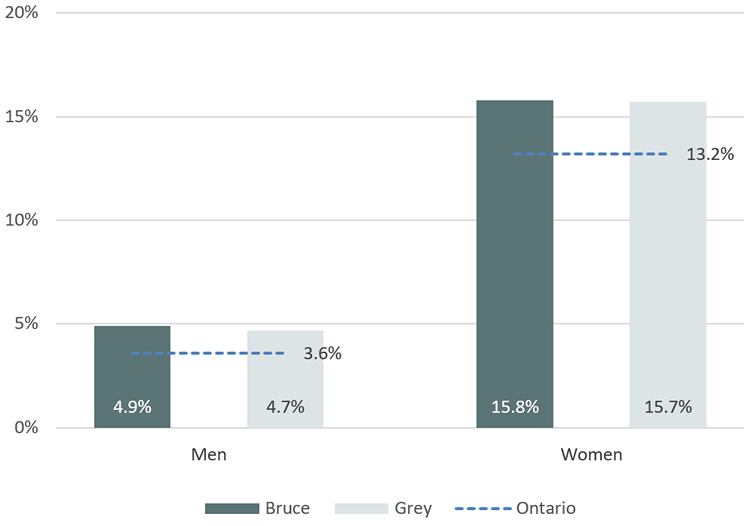
In 2016, older adults aged 65 years and older in Bruce and Grey Counties were more likely to be partnered than their provincial counterparts, but they were also more likely to be widowed (Table 3). Figure 6 presents the percentages of men and women aged 65+ in Bruce County, Grey County, and Ontario, who were widowed in 2016. Older adults who were widowed made up 10.5% of older adults in Bruce County, 10.4% in Grey County, and 8.6% in Ontario. Older adult women were much more likely to be widowed than older adult men both locally and provincially.
Table 3. Marital Status of Older Adults (65+), Ontario, Bruce County, and Grey County, 2015
|
|
Sex
|
Population
|
Partnered (%)
|
Not-Partnered
All Not-Partnered (%)
|
Widowed (%)
|
|
Ontario
|
Total
|
13,492,170
|
7,829,350 (58.0)
|
5,662,830 (42.0)
|
1,165,855 (8.6)
|
| |
Women
|
7,048,755
|
3,832,015 (54.4)
|
3,216,740 (45.6)
|
933,805 (13.2)
|
| |
Men
|
6,443,430
|
3,997,340 (62.0)
|
2,446,090 (38.0)
|
232,060 (3.6)
|
|
Grey Bruce
|
Total
|
176,030
|
112,730 (64.0)
|
63,290 (36.0)
|
18,365 (10.4)
|
|
|
Women
|
90,560
|
55,090 (60.8)
|
35,480 (39.2)
|
14,255 (15.7)
|
|
|
Men
|
85,460
|
57,660 (67.5)
|
27,820 (32.6)
|
4,095 (4.8)
|
|
Bruce
|
Total
|
73,460
|
47,840 (65.1)
|
25,605 (34.9)
|
7,710 (10.5)
|
| |
Women
|
37,625
|
23,350 (62.1)
|
14,285 (38.0)
|
5,955 (15.8)
|
| |
Men
|
35,830
|
24,510 (68.4)
|
11,325 (31.6)
|
1,750 (4.9)
|
|
Grey
|
Total
|
102,570
|
64,890 (63.3)
|
37,685 (36.7)
|
10,655 (10.4)
|
| |
Women
|
52,935
|
31,740 (60.0)
|
21,195 (40.0)
|
8,300 (15.7)
|
| |
Men
|
49,630
|
33,150 (66.8)
|
16,495 (33.2)
|
2,345 (4.7)
|
Figure 6. Percentage of Men and Women Aged 65+ Who Are Widowed, Bruce County, Grey County and Ontario, 2016
Household Type
Households can be divided into census families and non-census families. Census family households can be one-family households (couple families with or without children, and lone-parent households), or multiple-family households (two or more families, or one family living with additional relatives or non-relatives). Non-census families include individuals who live alone, individuals who live with relatives, and individuals who live with non-relatives. Table 4 presents the older adult population (65+) in Ontario, Grey Bruce, and Bruce and Grey counties by household type.
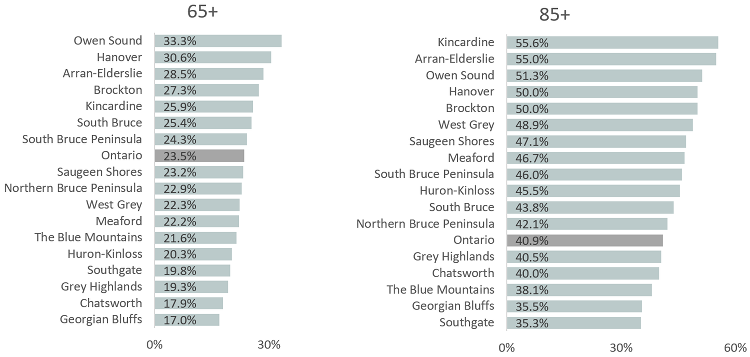
In 2016, most older adults (65+) in Grey Bruce lived in a census family with a married spouse or common-law partner, and without children. There was also a large percentage of older adults in Grey Bruce who lived alone. Figure 7 displays the percentages of older adults aged 65 and older, and 85 and older who lived alone in 2016. The percentage of older adults aged 65 and older who lived alone was similar to, or smaller than the provincial percentage in most Grey Bruce municipalities. Among older adults aged 85 and older, the percentage who lived alone was greater than the provincial percentage in most Grey Bruce municipalities.
Table 4. Population Aged 65+ by Household Type, Ontario, Grey Bruce, Bruce County and Grey County, 2016
|
Household Type
|
Ontario
|
Grey Bruce
|
Bruce
|
Grey
|
|
Population aged 65+
|
4,227,025
|
72,090
|
30,020
|
42,070
|
|
Adults living in census families
|
2,908,425 (68.8)
|
51,800 (71.9)
|
21,680 (72.2)
|
30,120 (71.6)
|
|
Married spouses and common-law partners
|
2,675,125 (63.3)
|
49,595 (68.8)
|
20,825 (69.4)
|
28,770 (68.4)
|
|
Without children in their census family
|
2,262,310 (53.5)
|
45,905 (63.7)
|
19,465 (64.8)
|
26,440 (62.8)
|
|
With children in their census family
|
412,825 (9.8)
|
3,690 (5.1)
|
1,350 (4.5)
|
2,340 (5.6)
|
|
Lone parents (in lone-parent census families)
|
222,500 (5.3)
|
2,110 (2.9)
|
825 (2.7)
|
1,285 (3.1)
|
|
Children in census families (as a son/daughter)
|
10,795 (0.3)
|
100 (0.1)
|
35 (0.1)
|
65 (0.2)
|
|
Adults not living in census families
|
1,318,605 (31.2)
|
20,255 (28.1)
|
8,320 (27.7)
|
11,935 (28.4)
|
|
Living with other relatives
|
244,320 (5.8)
|
1,635 (2.3)
|
575 (1.9)
|
1,060 (2.5)
|
|
Living with non-relatives only
|
80,970 (1.9)
|
1,200 (1.7)
|
390 (1.3)
|
810 (1.9)
|
|
Living alone
|
993,310 (23.5)
|
17,455 (24.2)
|
7,375 (24.6)
|
10,080 (24.0)
|
Figure 7. Percentage of Older Adults Aged 65+ and 85+ Who Live Alone, Grey Bruce Municipalities, 2016
Low Income Rate
According to the low income measures, after-tax (LIM-AT), a household has low income if its after-tax income is less than half of the median after-tax income of all households in Canada. The LIM is adjusted for household size because a household's needs increase as the number of members increases.
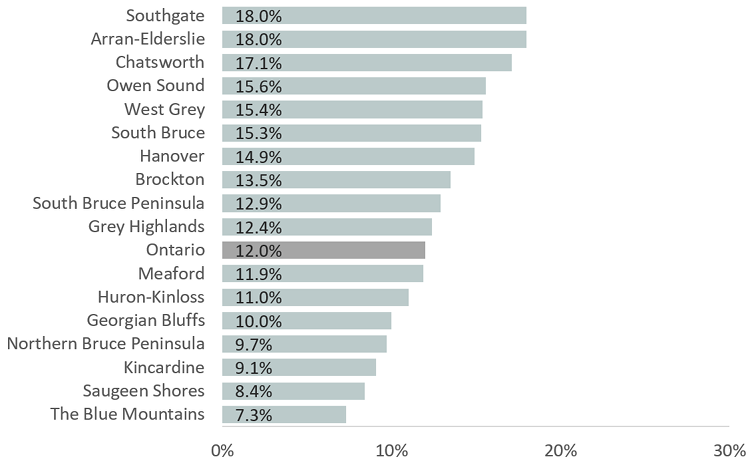
In 2015, 12.0% of older adults aged 65 years and older in Ontario lived in low-income households, according to the LIM-AT. The low-income rate among older adults was slightly lower than Ontario in Bruce County, at 11.5% and higher in Grey County, at 13.4%. Figure 8 displays the prevalence of low income in Grey Bruce municipalities among older adults aged 65 years and older in 2015. Around half of Grey Bruce municipalities had as many or more older adults in low-income households relative to Ontario. The highest low income rates among older adults were found in Southgate, Arran-Elderslie, and Chatsworth.
Figure 8. Percentage of Older Adults 65+ in Low-income Households, According to LIM-AT, Grey Bruce Municipalities, 2015
Older adult women were more likely to live in low-income households than older adult men (Figure 9). Table 5 displays the number of older adults living in low-income households in Grey Bruce municipalities, by sex, along with the proportion of their age group that they represent (e.g. 13.6% of women aged 65 years and older in Bruce County lived in low-income households in 2015). In every municipality, low-income rates were higher among women than men. This disparity was greatest in Owen Sound and Hanover.
Figure 9. Percentage of Men and Women Aged 65+ in Low-income Households, According to LIM-AT, Bruce County, Grey County and Ontario 2015
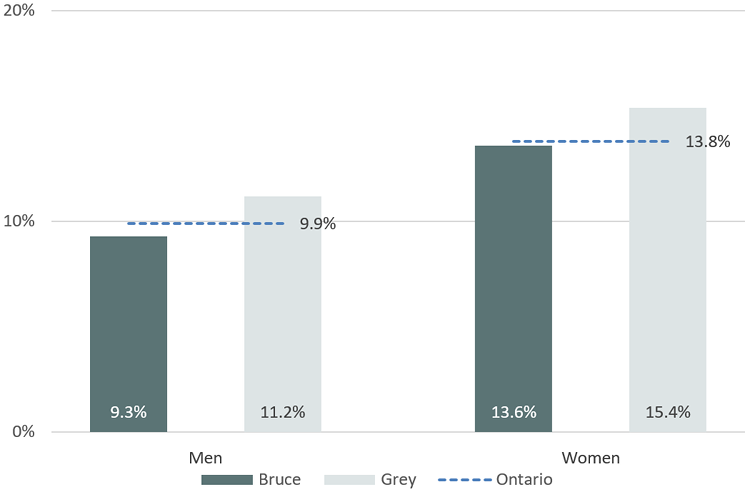
Table 5. Older Adults Aged 65+ in Low Income, Grey Bruce Municipalities, 2015
|
Geography
|
All (%)
|
Men (%)
|
Women (%)
|
|
Ontario
|
2,108,560 (12.0)
|
970,405 (9.9)
|
1,138,155 (13.8)
|
|
Grey Bruce
|
35,845 (12.6)
|
17,355 (10.4)
|
18,500 (14.6)
|
|
Bruce
|
14,815 (11.5)
|
7,225 (9.3)
|
7,595 (13.6)
|
|
Arran-Elderslie
|
1,250 (18.0)
|
615 (16.3)
|
630 (20.6)
|
|
Brockton
|
1,810 (13.5)
|
885 (11.9)
|
925 (15.1)
|
|
Huron-Kinloss
|
1,450 (11.0)
|
720 (9.0)
|
730 (13.0)
|
|
Kincardine
|
2,315 (9.1)
|
1,115 (6.3)
|
1,200 (11.7)
|
|
N. Bruce Peninsula
|
1,440 (9.7)
|
725 (9.7)
|
720 (10.4)
|
|
Saugeen Shores
|
3,150 (8.4)
|
1,495 (5.7)
|
1,655 (10.9)
|
|
South Bruce
|
950 (15.3)
|
470 (13.8)
|
480 (17.7)
|
|
S. Bruce Peninsula
|
2,445 (12.9)
|
1,190 (10.1)
|
1,255 (15.5)
|
|
Grey
|
21,030 (13.4)
|
10,130 (11.2)
|
10,905 (15.4)
|
|
Blue Mountains
|
2,260 (7.3)
|
1,150 (6.5)
|
1,110 (7.7)
|
|
Chatsworth
|
1,315 (17.1)
|
685 (16.1)
|
625 (18.4)
|
|
Grey Highlands
|
2,105 (12.4)
|
1,040 (10.6)
|
1,065 (15.0)
|
|
Georgian Bluffs
|
2,355 (10.0)
|
1,230 (9.3)
|
1,125 (10.7)
|
|
Hanover
|
1,750 (14.9)
|
770 (11.0)
|
980 (17.3)
|
|
Meaford
|
2,980 (11.9)
|
1,450 (9.7)
|
1,530 (14.1)
|
|
Owen Sound
|
4,485 (15.6)
|
1,920 (11.7)
|
2,565 (18.3)
|
|
Southgate
|
1,030 (18.0)
|
515 (16.5)
|
520 (19.2)
|
|
West Grey
|
2,760 (15.4)
|
1,370 (13.5)
|
1,385 (17.3)
|
Housing
The three key housing indicators collected by the census are: affordability (households spending 30% or more of their total household income on shelter costs are considered to have unaffordable housing), adequacy (dwellings in need of major repairs are considered to fall below adequacy standards), and suitability or “crowding” (dwellings with too few bedrooms for the size and composition of the household are considered to fall below suitability standards). See Table 6 and Table 7 for housing indicators at the municipal level, for both owner and renter households with primary household maintainers aged 65+. Primary household maintainer refers to the person residing in the household who is responsible for paying the rent, mortgage, or taxes, or the electricity or other services or utilities.
Figure 9 displays the percentages of private households in Bruce County, Grey County, and Ontario, with primary household maintainers aged 65 years and older, that were spending 30% or more of their household income on shelter costs in 2016. Older adults who rent have high rates of unaffordable shelter costs. Sixty percent of renter households with primary household maintainers aged 65+ have unaffordable shelter costs in Bruce County, as do 59.2% in Grey County and 62.5% in Ontario. Twelve percent of owner households with primary household maintainers aged 65+ have unaffordable shelter costs in Bruce County, as do 15.3% in Grey County and 16.5% in Ontario.
Figure 10. Percentage of Households with Primary Maintainers Aged 65+ that Have Unaffordable Shelter Costs, Bruce County, Grey County and Ontario 2016
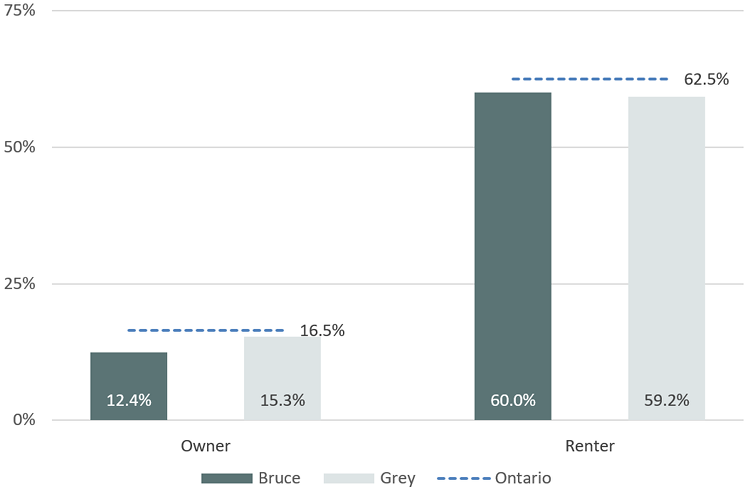
Table 6. Housing Indicators among Owner Households with Primary Household Maintainers Aged 65+, 2016
| |
Owner (All)
|
Owner
With Mortgage
|
Owner
Without Mortgage
|
|
Ontario
|
|
|
|
|
Total Primary Household Maintainers 65+
|
992,450
|
255,500
|
736,955
|
|
Unaffordable
|
163,315 (16.5)
|
101,470 (39.7)
|
61,840 (8.4)
|
|
Inadequate
|
40,600 (4.1)
|
15,120 (5.9)
|
25,470 (3.5)
|
|
Unsuitable
|
12,925 (1.3)
|
7,135 (2.8)
|
5,795 (0.8)
|
|
Unaffordable, Inadequate, or Unsuitable
|
203,900 (20.5)
|
114,695 (44.9)
|
89,205 (12.1)
|
|
Grey Bruce
|
|
|
|
|
Total Primary Household Maintainers 65+
|
18,090
|
4,295
|
13,805
|
|
Unaffordable
|
2,540 (14.0)
|
1,635 (38.1)
|
900 (6.5)
|
|
Inadequate
|
755 (4.2)
|
320 (7.5)
|
455 (3.3)
|
|
Unsuitable
|
65 (0.4)
|
20 (0.5)
|
45 (0.3)
|
|
Unaffordable, Inadequate, or Unsuitable
|
3,175 (17.6)
|
1,830 (42.6)
|
1,340 (9.7)
|
|
Bruce
|
|
|
|
|
Total Primary Household Maintainers 65+
|
7,665
|
1,740
|
5,930
|
|
Unaffordable
|
950 (12.4)
|
625 (35.9)
|
330 (5.6)
|
|
Inadequate
|
360 (4.7)
|
160 (9.2)
|
205 (3.5)
|
|
Unsuitable
|
35 (0.5)
|
10 (0.6)
|
35 (0.6)
|
|
Unaffordable, Inadequate, or Unsuitable
|
1,265 (16.5)
|
715 (41.1)
|
545 (9.2)
|
|
Grey
|
|
|
|
|
Total Primary Household Maintainers 65+
|
10,425
|
2,555
|
7,875
|
|
Unaffordable
|
1,590 (15.3)
|
1,010 (39.5)
|
570 (7.2)
|
|
Inadequate
|
395 (3.8)
|
160 (6.3)
|
250 (3.2)
|
|
Unsuitable
|
30 (0.3)
|
10 (0.4)
|
10 (0.1)
|
|
Unaffordable, Inadequate, or Unsuitable
|
1,910 (18.3)
|
1,115 (43.6)
|
795 (10.1)
|
Table 7. Housing Indicators among Renter Households with Primary Household Maintainers Aged 65+, 2016
|
|
Renter (All)
|
Renter
Subsidized
|
Renter
Not Subsidized
|
|
Ontario
|
|
|
|
|
Total Primary Household Maintainers 65+
|
303,315
|
73,215
|
230,105
|
|
Unaffordable
|
174,745 (57.6)
|
46,840 (64.0)
|
127,910 (55.6)
|
|
Inadequate
|
18,130 (6.0)
|
4,810 (6.6)
|
13,320 (5.8)
|
|
Unsuitable
|
10,835 (3.6)
|
1,630 (2.2)
|
9,220 (4.0)
|
|
Unaffordable, Inadequate, or Unsuitable
|
189,520 (62.5)
|
49,790 (68.0)
|
139,735 (60.7)
|
|
Grey Bruce
|
|
|
|
|
Total Primary Household Maintainers 65+
|
4,110
|
800
|
3,290
|
|
Unaffordable
|
2,445 (59.5)
|
505 (63.1)
|
1,925 (58.5)
|
|
Inadequate
|
135 (3.3)
|
30 (3.8)
|
105 (3.2)
|
|
Unsuitable
|
60 (1.5)
|
-
|
65 (2.0)
|
|
Unaffordable, Inadequate, or Unsuitable
|
2,555 (62.2)
|
520 (65.0)
|
2,035 (61.9)
|
|
Bruce
|
|
|
|
|
Total Primary Household Maintainers 65+
|
1,550
|
320
|
1,215
|
|
Unaffordable
|
930 (60.0)
|
225 (70.3)
|
705 (58.0)
|
|
Inadequate
|
30 (1.9)
|
10 (3.1)
|
20 (1.6)
|
|
Unsuitable
|
20 (1.3)
|
-
|
20 (1.6)
|
|
Unaffordable, Inadequate, or Unsuitable
|
945 (61.0)
|
230 (71.9)
|
715 (58.8)
|
|
Grey
|
|
|
|
|
Total Primary Household Maintainers 65+
|
2,560
|
480
|
2,075
|
|
Unaffordable
|
1,515 (59.2)
|
280 (58.3)
|
1,220 (58.8)
|
|
Inadequate
|
105 (4.1)
|
20 (4.2)
|
85 (4.1)
|
|
Unsuitable
|
40 (1.6)
|
-
|
45 (2.2)
|
|
Unaffordable, Inadequate, or Unsuitable
|
1,610 (62.9)
|
290 (60.4)
|
1,320 (63.6)
|
Educational Attainment
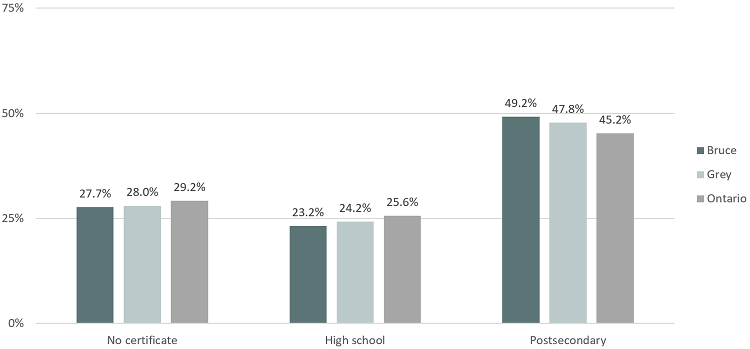
Educational attainment refers to the highest level of education that a person has successfully completed. Figure 11displays the highest educational attainment among those aged 65+ in Bruce County, Grey County, and Ontario in 2016. Just under 30% of older adults aged 65 years and older in Bruce and Grey counties had no educational qualifications in 2016, which is slightly lower relative to older adults in Ontario. Older adults whose highest educational qualification was a high school diploma made up 23.2% of older adults in Bruce County and 24.2% in Grey County, just under the provincial percentage of 25.6%. Just under half of older adults in Bruce and Grey counties had postsecondary qualifications, slightly higher than their provincial counterparts at 45.2%.
Figure 11. Highest Educational Attainment among Older Adults Aged 65+, Bruce County, Grey County and Ontario, 2016
Immigration
Canada’s immigrant population is defined as persons who are, or who have been, landed immigrants a.k.a. permanent residents in Canada. A landed immigrant is not a Canadian citizen by birth, but has been granted the right to live in Canada permanently by immigration authorities. Refugees, students, and those with work permits or Minister’s permits are not landed immigrants, but non-permanent residents. Non-permanent residents are persons from another country who have a work or study permit or who are refugee claimants, along with their family members sharing the same permit and living in Canada with them.
Table 8 displays the immigrant status of older adults aged 65+ in Ontario, Bruce County, and Grey County in 2016. Immigrants and non-permanent residents made up a small percentage of the population aged 65+ in both Bruce and Grey counties in 2016. As is the case in other age groups, the percentage of older adults in Grey Bruce who were or had ever been landed immigrants or non-permanent residents was lower than the Ontario percentage.
Table 8. Immigrant Status among Population Aged 65+, 2016
|
Immigrant Status
|
Geography (population aged 65+)
|
|
| |
Ontario (2,113,515)
|
Grey Bruce (36,030)
|
Bruce (15,000)
|
Grey (21,030)
|
|
Non-immigrants* (%)
|
1,166,790 (55.2)
|
29,925 (83.1)
|
12,655 (84.4)
|
17,270 (82.1)
|
|
Immigrants (%)
|
941,695 (44.6)
|
6,080 (16.9)
|
2,335 (15.6)
|
2,335 (15.6)
|
|
Non-permanent Residents (%)
|
941,695 (0.24)
|
35 (0.10)
|
20 (0.13)
|
15 (0.07)
|
*Non-immigrant population = persons who are Canadian citizens by birth
Projected Senior Population
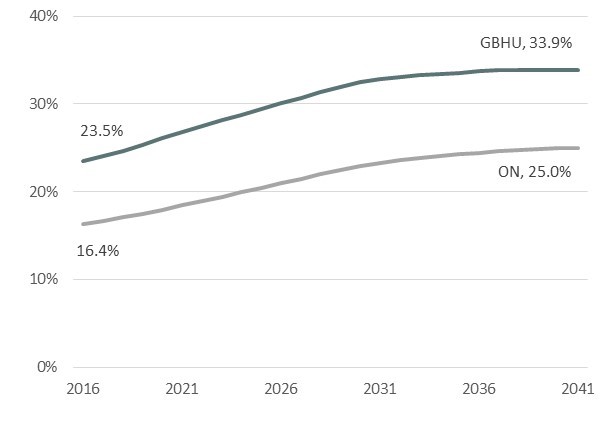
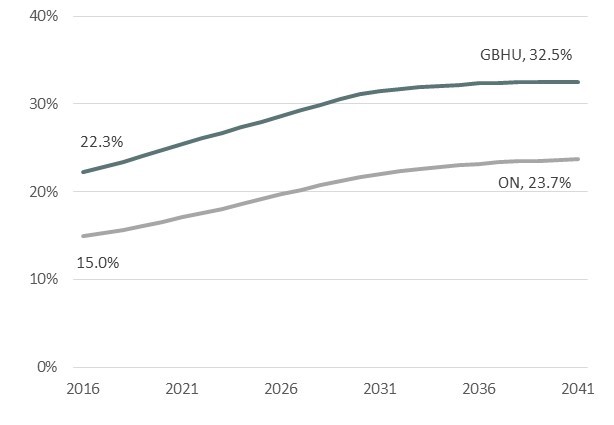
Based on the projections from the Ontario Ministry of Finance’s analysis of the 2016 Census, the proportion of the Grey Bruce population that is senior-aged will increase from approximately 1 in 4 in 2016 to approximately 1 in 3 by 2041. By comparison, the current senior-aged population proportion in Ontario is about 1 in 6, and is projected to increase to 1 in 4 by 2014. Figure 12 presents the projected senior population proportions for the Grey Bruce and Ontario populations overall, while Figures 13 and 14 present the projected senior population proportions among females and males, respectively.
Figure 12. Projected Senior Population, Grey Bruce and Ontario, 2016–2041
Trends are similar between males and females, although rates are slightly higher among females, reflecting the higher senior life expectancy among females (currently 22.2 additional years among females aged 65 compared to 19.5 years among males aged 65 based on 2015-2017 Grey Bruce data).
Figure 13. Projected Senior Population, Grey Bruce and Ontario Females, 2016–2041
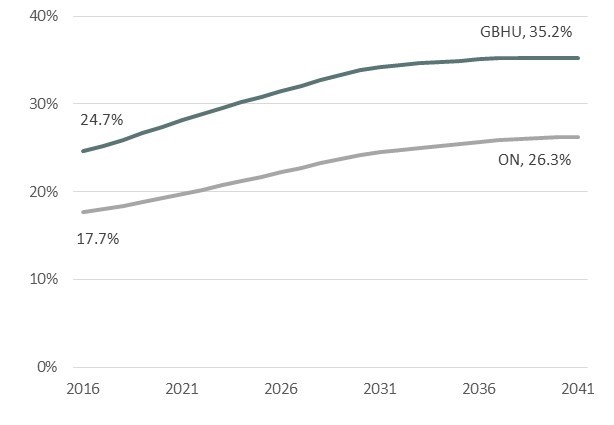
Figure 14. Projected Senior Population, Grey Bruce and Ontario Males, 2016–2041
Because population projections are founded on assumptions about births, deaths and migrations over the projection period, they should be used cautiously. The risk of inaccuracy increases with smaller age groups or geographies.
References
[1] Statistics Canada. 2010. Demographic Change. Healthy People, Healthy Places, Statistics Canada Catalogue no. 82-229-X. Ottawa. https://www.statcan.gc.ca/pub/82-229-x/2009001/demo/dep-eng.htm#shr-pg-pnl6. Published Jan 11, 2010. Accessed March 5, 2017.
All indicators, except for simple population counts and age distributions are based on persons living in private households and do not include, for example, older adults living in long-term care facilities.
Data specific to Neyaashiinigmiing and Saugeen First Nations are not presented due to high non-response rates
To ensure confidentiality, the values, including totals, are randomly rounded either up or down to a multiple of '5' or '10.' To understand these data, you must be aware that each individual value is rounded. A value of zero (-) does not necessarily mean that there are no people in that particular category.
Sources:
Population: Statistics Canada. 2017. Various Geographies. Census Profile. 2016 Census. Statistics Canada Catalogue no. 98-316-X2016001. Ottawa. Released May 3, 2017. http://www12.statcan.gc.ca/census-recensement/2016/dp-pd/prof/index.cfm?Lang=E (accessed May 5, 2017).
Low Income Rate: Statistics Canada. 2017. Various Geographies. Census Profile - Age, Sex, Type of Dwelling, Families, Households, Marital Status, Language and Income for Canada, Provinces and Territories, Census Divisions and Census Subdivisions. 2016 Census. Statistics Canada Catalogue no. 98-401-X2016052. Ottawa. Released Sept 13, 2017. http://www5.statcan.gc.ca/olc-cel/olc.action?objId=98-401-X2016053&objType=46&lang=en&limit=0 (accessed Sept 13 2017).
Marital status: Statistics Canada, 2016 Census of Population, Statistics Canada Catalogue no. 98-400-X2016035. http://www12.statcan.gc.ca/census-recensement/2016/dp-pd/dt-td/Rp-eng.cfm?TABID=1&LANG=E&A=R&APATH=3&DETAIL=0&DIM=0&FL=A&FREE=0&GC=01&GL=-1&GID=1159582&GK=1&GRP=1&O=D&PID=109654&PRID=10&PTYPE=109445&S=0&SHOWALL=0&SUB=0&Temporal=2016&THEME=117&VID=0&VNAMEE=&VNAMEF=&D1=0&D2=0&D3=0&D4=0&D5=0&D6=0
Family structure: Statistics Canada, 2016 Census of Population, Statistics Canada Catalogue no. 98-400-X2016029. http://www12.statcan.gc.ca/census-recensement/2016/dp-pd/dt-td/Rp-eng.cfm?TABID=1&LANG=E&A=R&APATH=3&DETAIL=0&DIM=0&FL=A&FREE=0&GC=01&GL=-1&GID=1159582&GK=1&GRP=1&O=D&PID=109648&PRID=10&PTYPE=109445&S=0&SHOWALL=0&SUB=0&Temporal=2016&THEME=117&VID=0&VNAMEE=&VNAMEF=&D1=0&D2=0&D3=0&D4=0&D5=0&D6=0
Housing: Statistics Canada, 2016 Census of Population, Statistics Canada Catalogue no. 98-400-X2016231.
http://www12.statcan.gc.ca/census-recensement/2016/dp-pd/dt-td/Rp-eng.cfm?TABID=1&LANG=E&A=R&APATH=3&DETAIL=0&DIM=0&FL=A&FREE=0&GC=35&GL=-1&GID=1259598&GK=1&GRP=1&O=D&PID=110575&PRID=10&PTYPE=109445&S=0&SHOWALL=0&SUB=0&Temporal=2017&THEME=121&VID=0&VNAMEE=&VNAMEF=&D1=6&D2=0&D3=0&D4=0&D5=0&D6=0
Immigration: Source: Statistics Canada, 2016 Census of Population, Statistics Canada Catalogue no. 98-400-X2016185. http://www12.statcan.gc.ca/census-recensement/2016/dp-pd/dt-td/Rp-eng.cfm?TABID=1&LANG=E&A=R&APATH=3&DETAIL=0&DIM=0&FL=A&FREE=0&GC=01&GL=-1&GID=1257309&GK=1&GRP=1&O=D&PID=110526&PRID=10&PTYPE=109445&S=0&SHOWALL=0&SUB=0&Temporal=2017&THEME=120&VID=0&VNAMEE=&VNAMEF=&D1=0&D2=0&D3=0&D4=0&D5=0&D6=0
Definitions: Statistics Canada, 2016. Dictionary, Census of Population 2016. http://www12.statcan.gc.ca/census-recensement/2016/ref/dict/index-eng.cfm
Projections: Population Projections (2016). Ontario Ministry of Finance. Retrieved from IntelliHEALTH Ontario, September 10, 2019.
Life Expectancy: Statistics Canada. Table 13-10-0389-01. Life expectancy, at birth and age at 65, by sex, three-year average, Canada, provinces, territories, health regions and peer groups.