Knowledge of Official Languages
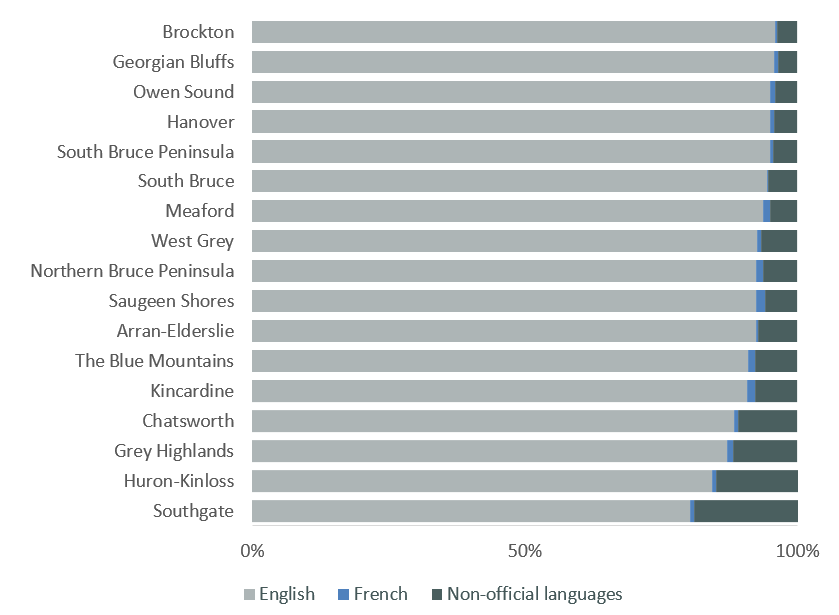
The following table and accompanying figure display knowledge of official languages in Grey and Bruce counties (ability to carry out a conversation in English and/or French). Limited language proficiency could influence health by: 1) impairing access to health services; 2) creating economic difficulties; and 3) reducing social participation.[1] Most communities in Grey Bruce have very low proportions (i.e. less than 3%) of people who cannot speak English nor French. Exceptions include Southgate, Huron-Kinloss, Grey Highlands, Chatsworth, and Arran-Elderslie.
Table: Knowledge of Official Languages, Grey Bruce 2016
|
Geography
|
English only
|
English and French
|
French only
|
Neither English nor French
|
|
Ontario
|
86.0
|
11.2
|
0.3
|
2.5
|
|
Bruce
|
94.3
|
5.2
|
0.0
|
0.5
|
|
Arran-Elderslie
|
95.5
|
3.3
|
0.1
|
1.2
|
|
Brockton
|
95.9
|
4.0
|
0.0
|
0.1
|
|
Huron-Kinloss
|
93.3
|
4.3
|
0.0
|
2.4
|
|
Kincardine
|
92.1
|
7.7
|
0.0
|
0.3
|
|
Northern Bruce Peninsula
|
95.5
|
4.4
|
0.0
|
0.1
|
|
Saugeen Shores
|
92.7
|
7.1
|
0.0
|
0.1
|
|
South Bruce
|
95.8
|
3.9
|
0.0
|
0.3
|
|
South Bruce Peninsula
|
95.6
|
4.4
|
0.0
|
0.1
|
|
Grey
|
93.7
|
5.7
|
0.0
|
0.6
|
|
The Blue Mountains
|
91.4
|
8.4
|
0.0
|
0.1
|
|
Chatsworth
|
94.5
|
4.3
|
0.0
|
1.2
|
|
Georgian Bluffs
|
94.7
|
5.2
|
0.0
|
0.0
|
|
Grey Highlands
|
93.2
|
5.3
|
0.2
|
1.4
|
|
Hanover
|
94.2
|
5.5
|
0.0
|
0.3
|
|
Meaford
|
92.6
|
7.2
|
0.0
|
0.2
|
|
Owen Sound
|
93.1
|
6.6
|
0.0
|
0.2
|
|
Southgate
|
93.7
|
3.8
|
0.0
|
2.6
|
|
West Grey
|
95.7
|
4.1
|
0.0
|
0.3
|
Figure: Knowledge of Official Languages, Grey Bruce Municipalities 2016

Read the full report here: Census Release III Languages
[1] Chiswick BR, Lee YL, Miller PW. Immigrant Selection Systems and Immigrant Health [Internet]. Bonn, Germany: Institute for the Study of Labor; 2006. Available from: https://pdfs.semanticscholar.org/eaa1/a65223e096f279b7ab981aef12695ab7c3bf.pdf
Source: 2017. Various Geographies. Census Profile - Age, Sex, Type of Dwelling, Families, Households, Marital Status and Language for Canada, Provinces and Territories, Census Divisions and Census Subdivisions. 2016 Census. Statistics Canada Catalogue no. 98-401-X2016052. Ottawa. Released Aug 2, 2017. http://www5.statcan.gc.ca/olc-cel/olc.action?objId=98-401-X2016052&objType=46&lang=en&limit=0 (accessed Aug 2 2017).
Note: Data from Neyaashiinigmiing and Saugeen First Nations are not presented due to high non-response rates (30.5% and 46.0% respectively